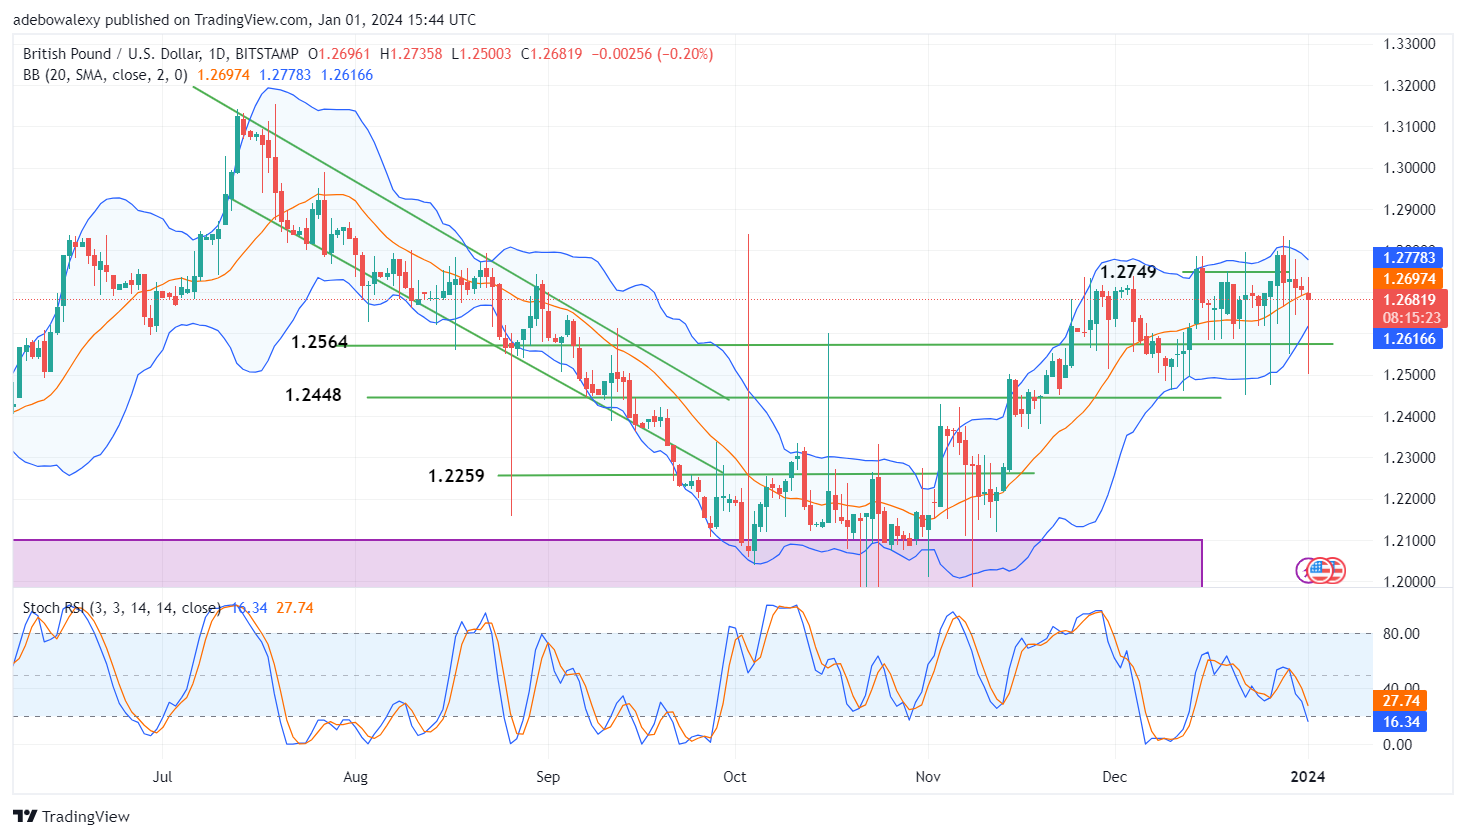
Despite weak volatility in price action, the GBPUSD market continues its descent below key levels, failing to establish support above the 1.2749 price level. While technical indicators maintain a bearish outlook for the pair, a closer examination of price movement reveals intriguing developments in this market.
Key Price Levels:
Resistance Levels: 1.2700, 1.2750, and 1.2800
Support Levels: 1.2683, 1.2650, and 1.2600

Positive Contraction Occurs in the GBPUSD Market
During today’s trading session, GBPUSD’s price action dipped below the Bollinger Bands MA line. Considering the lower shadow of the session’s price candle, it suggests that the price action had initially breached the support at the 1.2564 mark. However, as trading activity persisted, the pair regained momentum, resulting in a positive contraction that propelled GBPUSD to trade above the 1.2680 mark.
The corresponding price candle now sits below the middle limit of the Bollinger Bands. Furthermore, both the upper and lower limits of the Bollinger Bands are contracting, indicating potential strength in upside forces. Nevertheless, the RSI lines continue to trend downward, posing a discrepancy with bullish expectations for this market.

GBPUSD Leaps Upwards
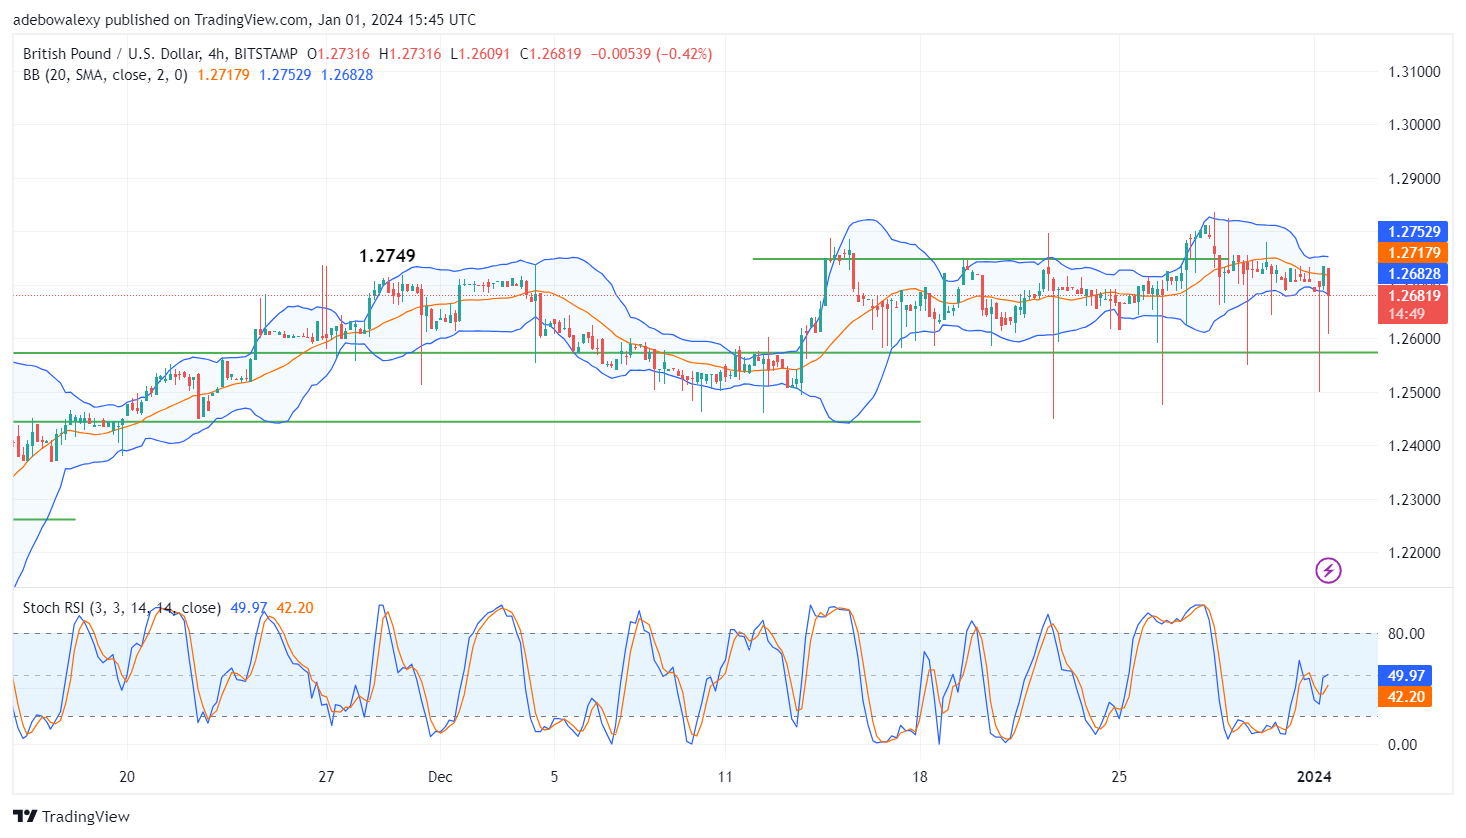
The 4-hour GBPUSD market reveals that price action is currently situated on a baseline that may trigger an upward bounce. The ongoing session’s price candle rests on the lowest band of the Bollinger Bands indicator. Similar to the daily market, positive contractions are evident in this session.
Simultaneously, the Stochastic RSI line maintains an upward trajectory, with its leading edge slightly deviating from a sharply upward path. This suggests a reasonable upside momentum in the market, leading traders to anticipate the 1.2700 mark.
Do you want to take your trading to the next level? Join the best platform for that here.


Leave a Reply