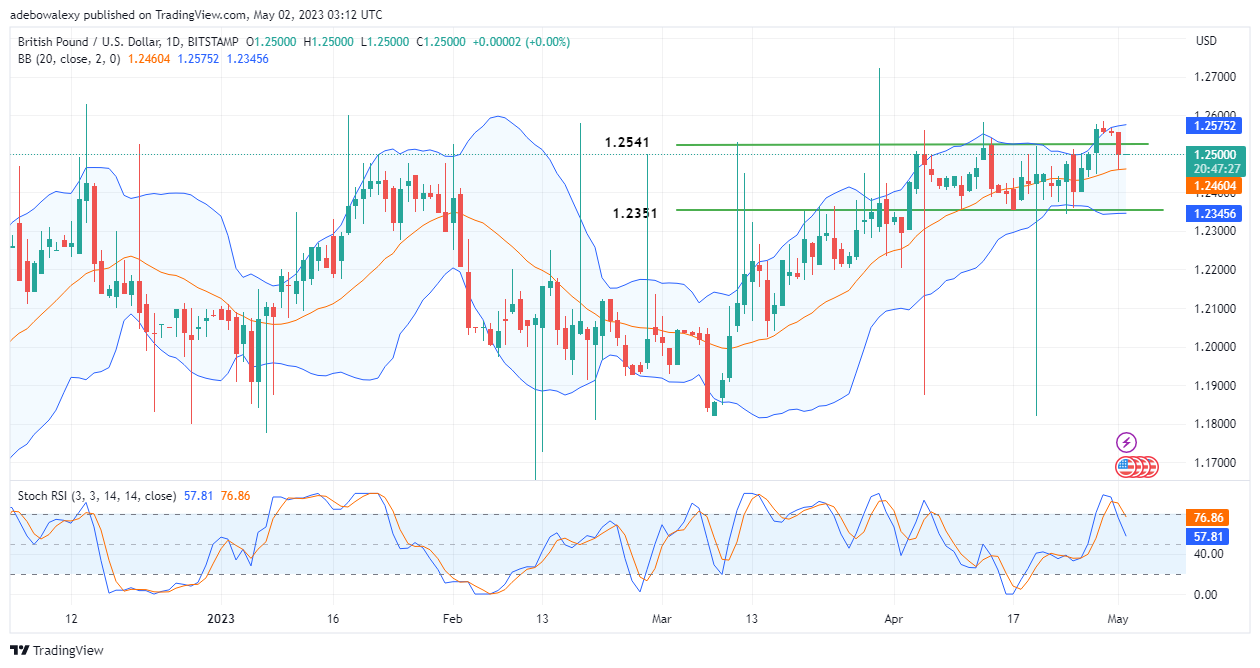
The recent strengthening of the US dollar has had a negative impact on GBPUSD price movements. This is because price action has been forced to fall back under the resistance at 1.2541 after breaking it to the upside.
Major Price Levels:
Resistance Levels: 1.2500, 1.2530, and 1.2560
Support Levels: 1.2480, 1.2450, and 1.2420

GBPUSD Bulls Are Up Against Headwind
A headwind seems to have developed in the GBPUSD daily market, following the recent strengthening of the dollar. This is further expressed by the appearance of the last price candle here, as it only managed to place the price at 1.2500. However, price activity stays above the middle band of the Bollinger Bands indicator, which suggests that prices may still retrace higher. Meanwhile, the Relative Strength Index (RSI) seems to possess a rather bearish tone. Both the Bollinger Bands indicator and the Stochastic RSI indicator are against each other, going by the indications that they suggest. This will cause traders to exercise patience as they wait for more confirmation.

GBPUSD Market Seems Choppy, as Price Action Bounced off Support
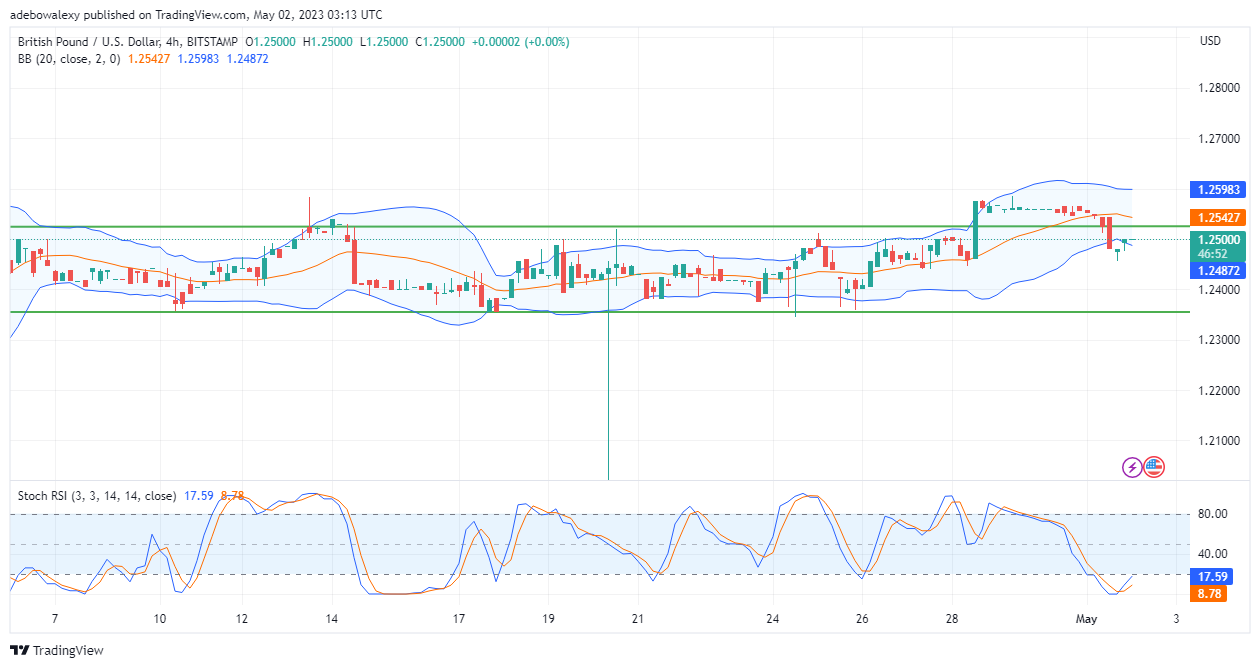
On the 4-hour chart, GBPUSD price action has bounced moderately off the support level formed by the lowest limit of the Bollinger Bands. Another trading session has begun in favor of buyers with the appearance of the last dashed-shaped price candle. At the same time, the RSI indicator suggests that price activity may gain more upside traction as trading activities continue. This suggestion comes from the fact that the Relative Strength Index (RSI) indicator has given a crossover and its lines are rising upward. Therefore, it appears that price action may break the resistance at 1.2541 once more, provided that bulls can retain control on this front.
Do you want to take your trading to the next level? Join the best platform for that here.


Leave a Reply