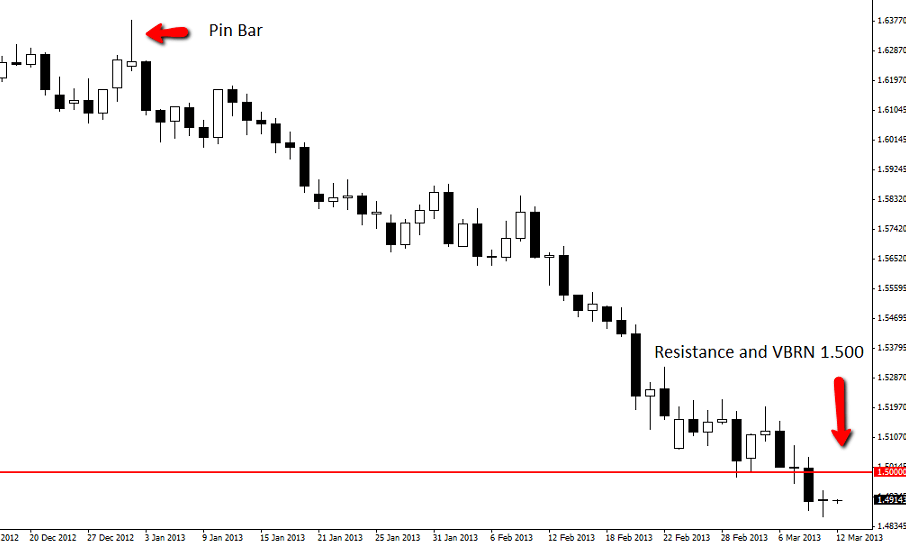
The GBPUSD has been in a heavy down-trend in recent times. This avalanche lower was kicked off by a large false break Pin Bar that stuck out up at the high and away from all other price.
People that follow this blog would know that a common mistake traders make is by trying to trade against to the obvious trend. Instead of fighting the clear trending bias, we look for obvious trends that are in place and then look for logical areas to enter within them.
With this obvious trend lower in place, we are now looking for short trades from value areas. Instead of just spotting the trend and then jumping aboard a trade, it is important we locate logical areas of support or resistance for our entries.
On the daily chart of the GBPUSD we can see there was an previous support area that price stalled at before continuing lower. If price rotates back higher into this level price action traders could look for price to give off bearish signals for a possible trend resumption. Looking for bearish traders at this area would mean trading with the trend rather than against it and also entering from the correct swing high. You will also notice this resistance area is also a Very Big Round Number of 1.5000.
GBPUSD DAILY CHART | 12 mAR 2013


Leave a Reply