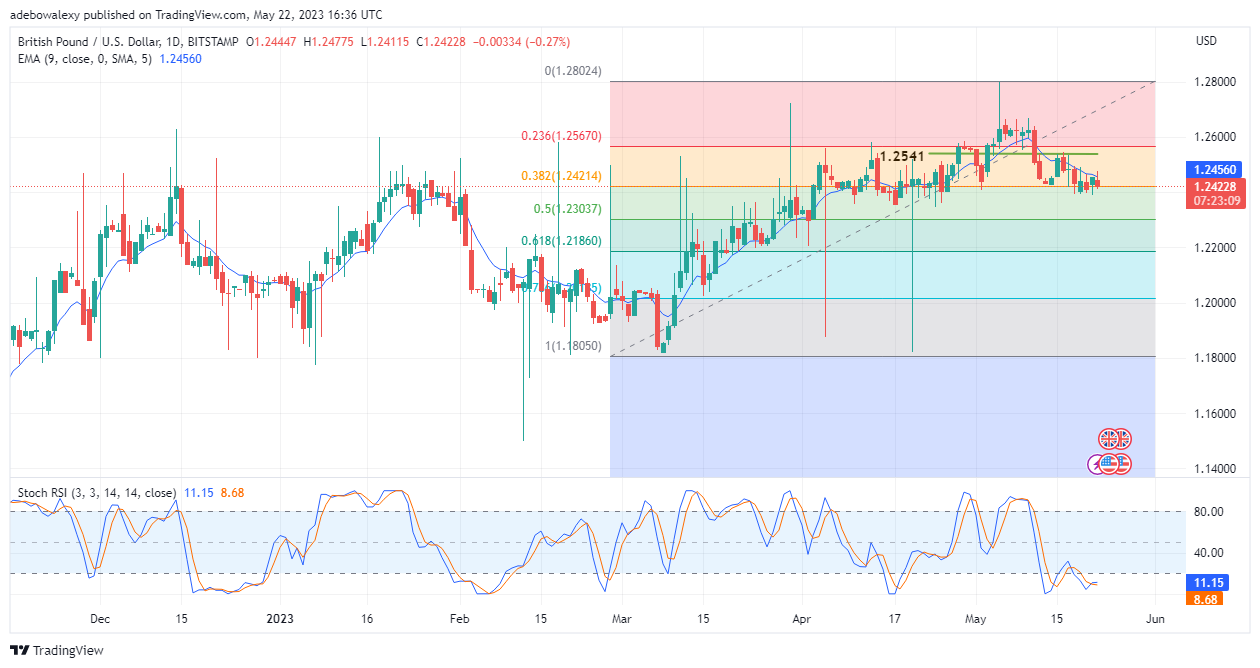
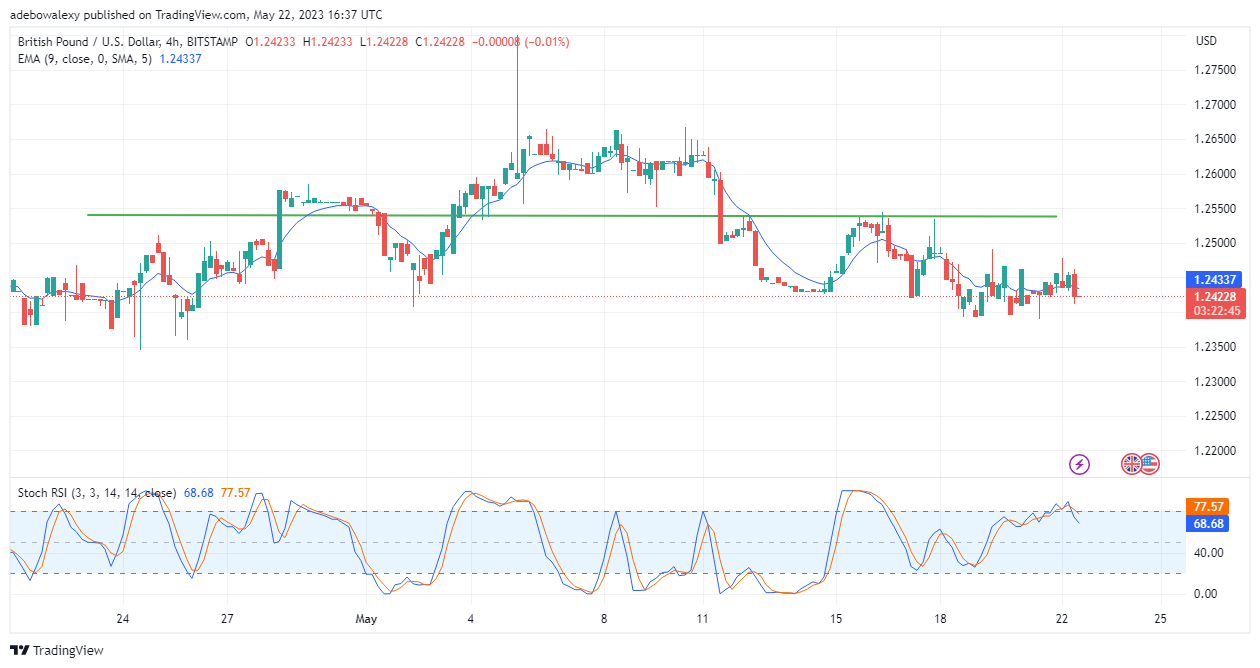
The GBPUSD seems to lack major impetus, as its price action retraces the 1.2420 price mark. However, it is necessary to examine the chances of price action falling to 1.2400. This is because more downward retracement is probable should prices fall through this important support.
Major Price Levels:
Resistance Levels: 1.2450, 1.2480, and 1.2510
Support Levels: 1.2420, 1.2400, and 1.2375

GBPUSD Lacks Direction
Price movement in the GBPUSD 24-hour market seems to lack a clear direction. Also, price action stays below the 9-day Moving Average curve but still stands above the 1.2420 mark as of the time of writing. Furthermore, studying the behaviour of the Relative Strength Index (RSI) reveals that price action doesn’t have a clear direction. The lines of the RSI only point sideways and not upwards after it has performed a crossover. This may induce a panic sell-off should the price fall below the 1.2420 threshold.

GBPUSD Begins a New Bearish Session
On the 4-hour market, the prices remain under the 9-day MA line. Furthermore, a new session has begun, with sellers taking the lead. This can be observed as a dashed-shaped price candle has just appeared in the market. In addition, the Stochastic RSI curves are now plunging downward from above the 75 mark of the indicator. This implies that traders should prepare to witness more downside retracements. toward the 1.2400 price mark. However, it will be beneficial to keep tabs on economic development coming from the United Kingdom.
Do you want to take your trading to the next level? Join the best platform for that here.


Leave a Reply