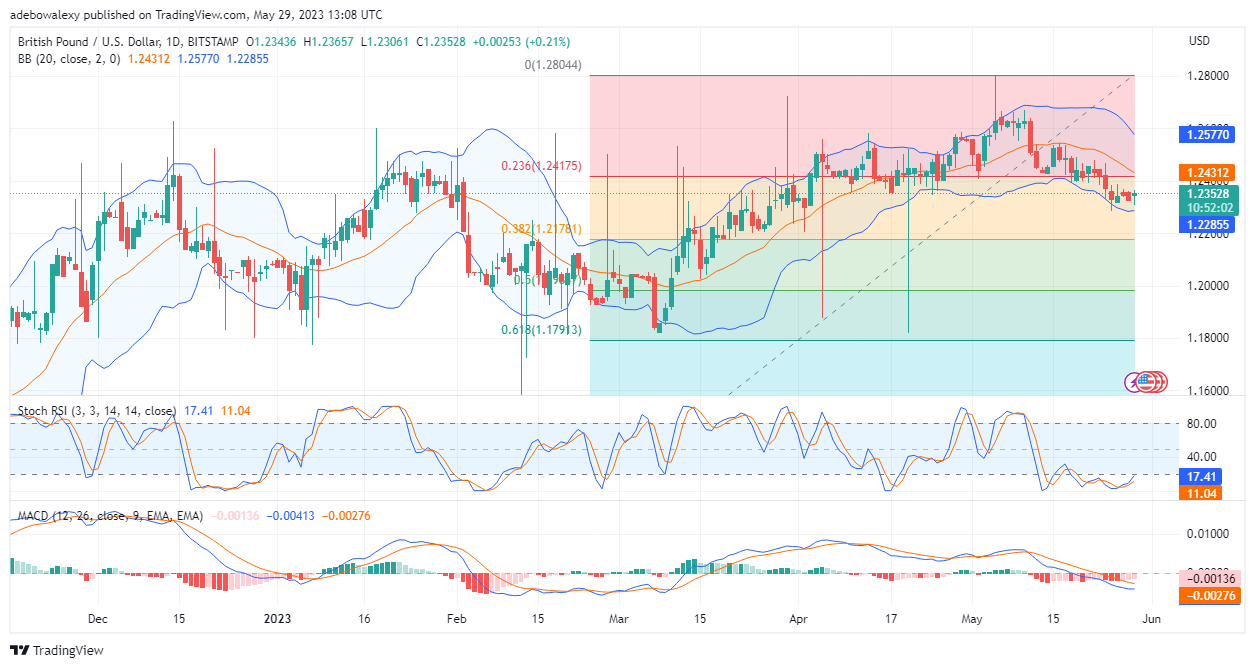
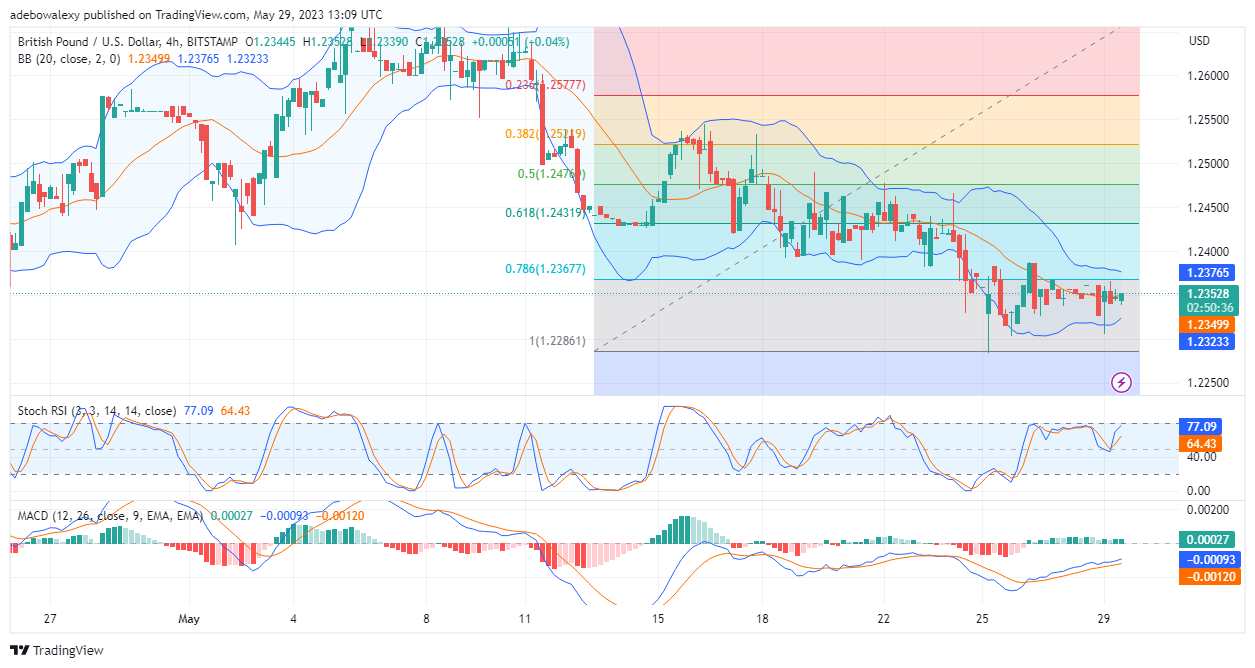
GBPUSD price action has taken off towards the 1.2400 mark. This seems to have developed over the past three trading sessions, when prices bounced off the 1.2280 price level. There are signs that price action may pick up more momentum as trading activities continue for the week.
Major Price Levels:
Resistance Levels: 1.2353, 1.2383, and 1.2420
Support Levels: 1.2333, 1.2300, and 1.2270

GBPUSD Gathers Minimal Profits Towards the 1.2400
Price action in the GBPUSD daily market broke through the 1.2417 support over five trading sessions ago. The downward retracement continued until it reached the lowest limit of the Bollinger Bands. Ever since then, there has been a minor but steady rise towards the once-broken support as resistance. The Relative Strength Index curves are now rising steadily towards the 20 mark of the indicator. At the same time, the Moving Average Divergence Convergence Indicator is already indicating a decline in downward momentum, which indicates that tailwinds can develop. This can be noticed as the MACD histogram bars are getting shorter and are now pale red.

GBPUSD Locks in the Target at the 1.2380 Price Level
GBPUSD seems to have picked up short-term resistance at the 1.2380 price mark. Also, the curves of the RSI indicator appear to be generally projected towards the 80 levels of the indicator. Meanwhile, the last price candlestick has pushed prices through the middle band of the Bollinger Bands indicator. Such activity on this chart suggests that price action now has more upside propensity. On the MACD indicator, it could be seen that the bars of this indicator are now appearing solid green, while its lines are gradually trending upwards. Once price action breaks the resistance at the 1.2380 price level, more upside resistance can be expected towards the 1.2400 mark.
Do you want to take your trading to the next level? Join the best platform for that here.


Leave a Reply