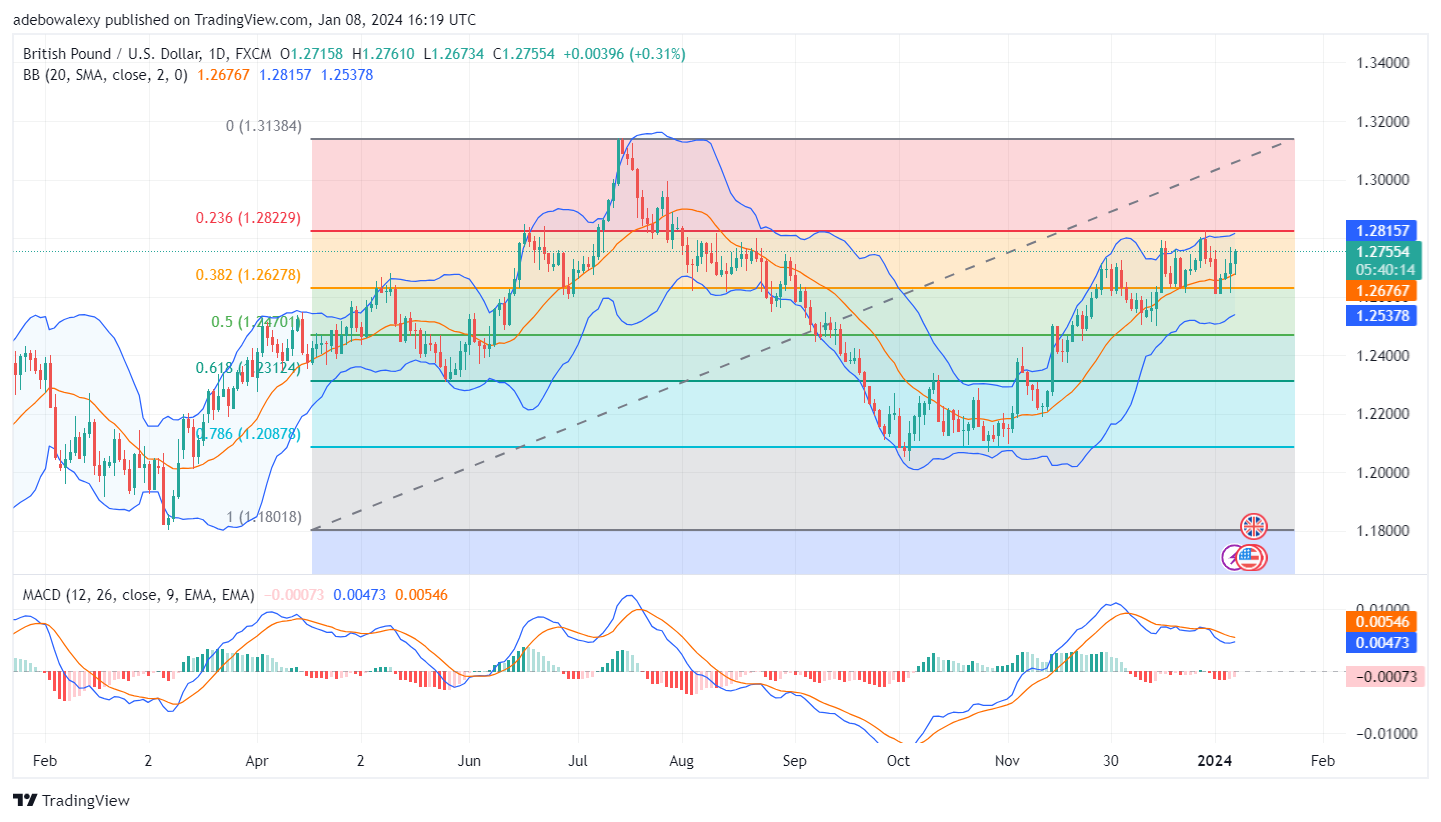
The GBPUSD price activity has been trading above the 1.2628 price level but hasn’t surpassed the 1.2823 mark. Nevertheless, traders can still boast of an optimistic outlook for this pair, as price action has remained in the green considering the outcomes of about three sessions ago.
Key Price Levels:
Resistance Levels: 1.2755, 1.2800, and 1.2900
Support Levels: 1.2700, 1.2600, and 1.2500

Buyers Maintain a Promising Outlook Above the 1.2677 Mark in the GBPUSD Market
GBPUSD buyers have continued to gather profits off the support at the 1.2600 mark. In the ongoing session, the pair has been able to remain above the middle limit of the applied Bollinger Bands indicator. Likewise, the appearance of the price candle that represents the ongoing session has signaled that the upside forces in this market are quite healthy.
Meanwhile, the Moving Average Convergence Divergence indicator lines are now converging for yet another bullish crossover at a considerable height above the equilibrium level. Furthermore, the bars of these indicator lines are now getting shorter and are now pale red in appearance. Consequently, this suggests that tailwinds may cause prices to rise as trading activities continue.

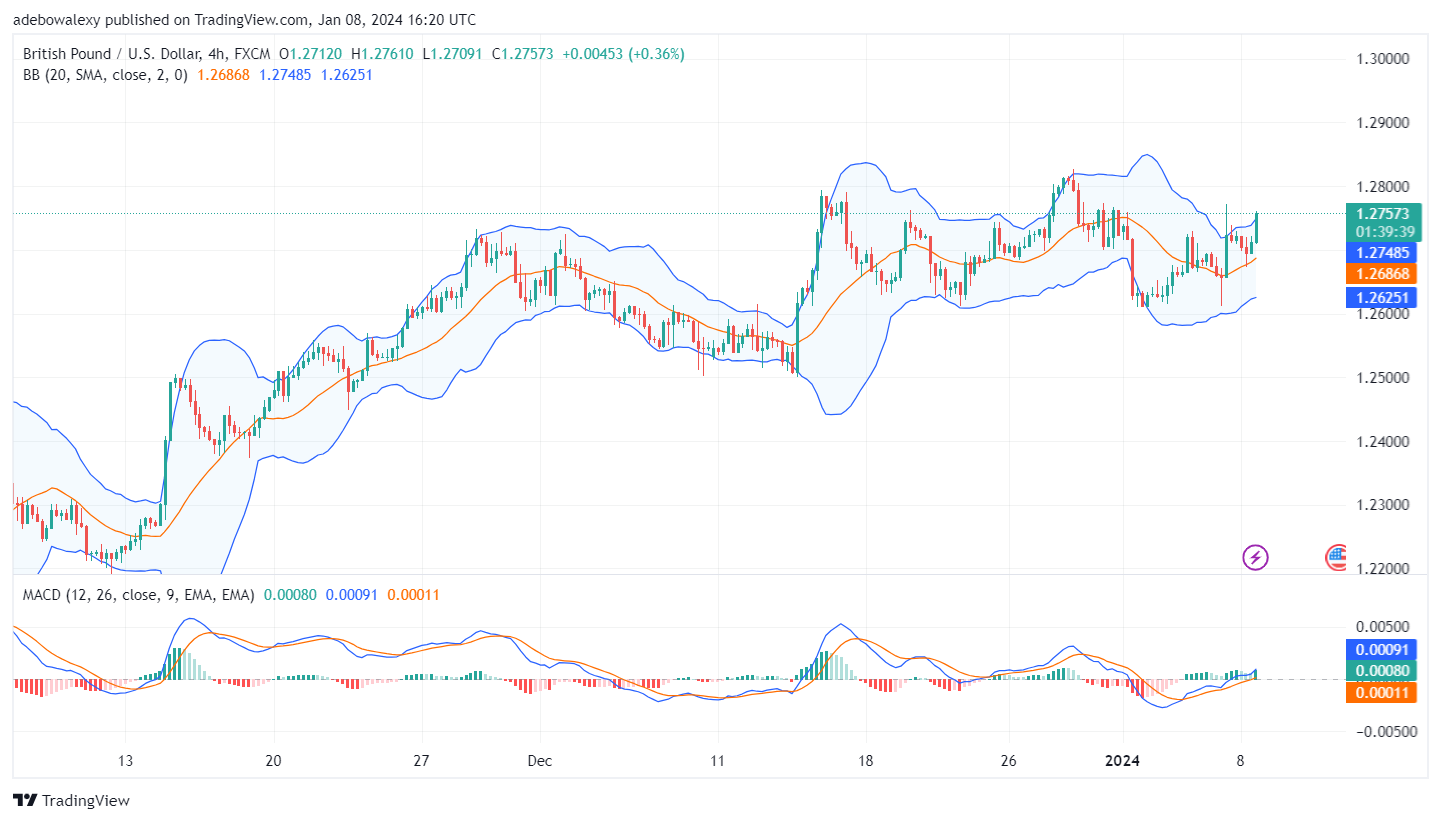
GBPUSD Eyes the 1.2800 Mark
Even in a 4-hour market, GBPUSD price activity has continued to trend upwards. Here, it can be seen that price action has started pushing the uppermost limits of the Bollinger Bands. This has tentatively placed the price of the pair outside the Bollinger Bands ceiling. Likewise, the support found at 1.2687 seems to be holding up quite well.
Additionally, the MACD lines have crossed above the equilibrium level, while the last bar of the indicator seems quite conspicuous enough. By implication, this suggests that bullish momentum is up and has a higher chances of propelling the market further upward towards the 1.2800 mark ahead of any corresponding and market-stimulating fundamentals.
Do you want to take your trading to the next level? Join the best platform for that here.


Leave a Reply