Today’s trading session has assisted the GBPUSD pair to gather additional minimal profits. However, the pair might still be considered bearish if observing the market over the medium term. Will price action break the overall downtrend? Let’s take a closer look to find out.
Major Price Levels:
Resistance Levels: 1.2401, 1. 2450, and 1.2500
Support Levels: 1.2400, 1.2350, and 1.2300

GBPUSD May Be Eying the 1.2440 Mark
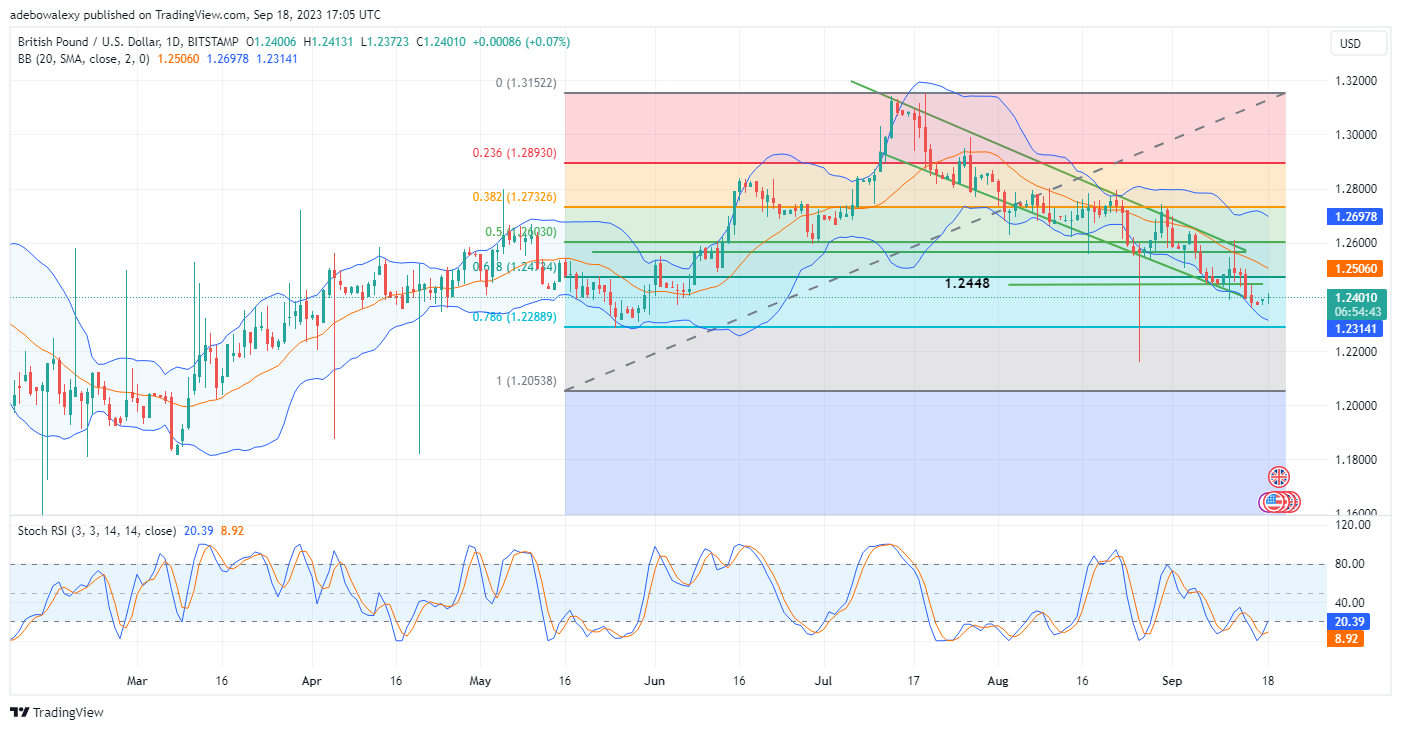
GBPUSD’s price action on the daily market has been trending downward since last Friday. And although it looked quite insignificant, today’s trading session has continued with the trend as price action recovered trading above the 1.2400 mark, though by a nose lead.
Meanwhile, the Relative Strength Index (RSI) indicator has delivered a bullish crossover below the 20 level. Consequently, this suggests that should buyers be able to retain the lead, more upside marks may be recovered at this point. However, favorable fundamentals will be a major contributing factor to that.

GBPUSD Seems to Have Found a Strong Baseline
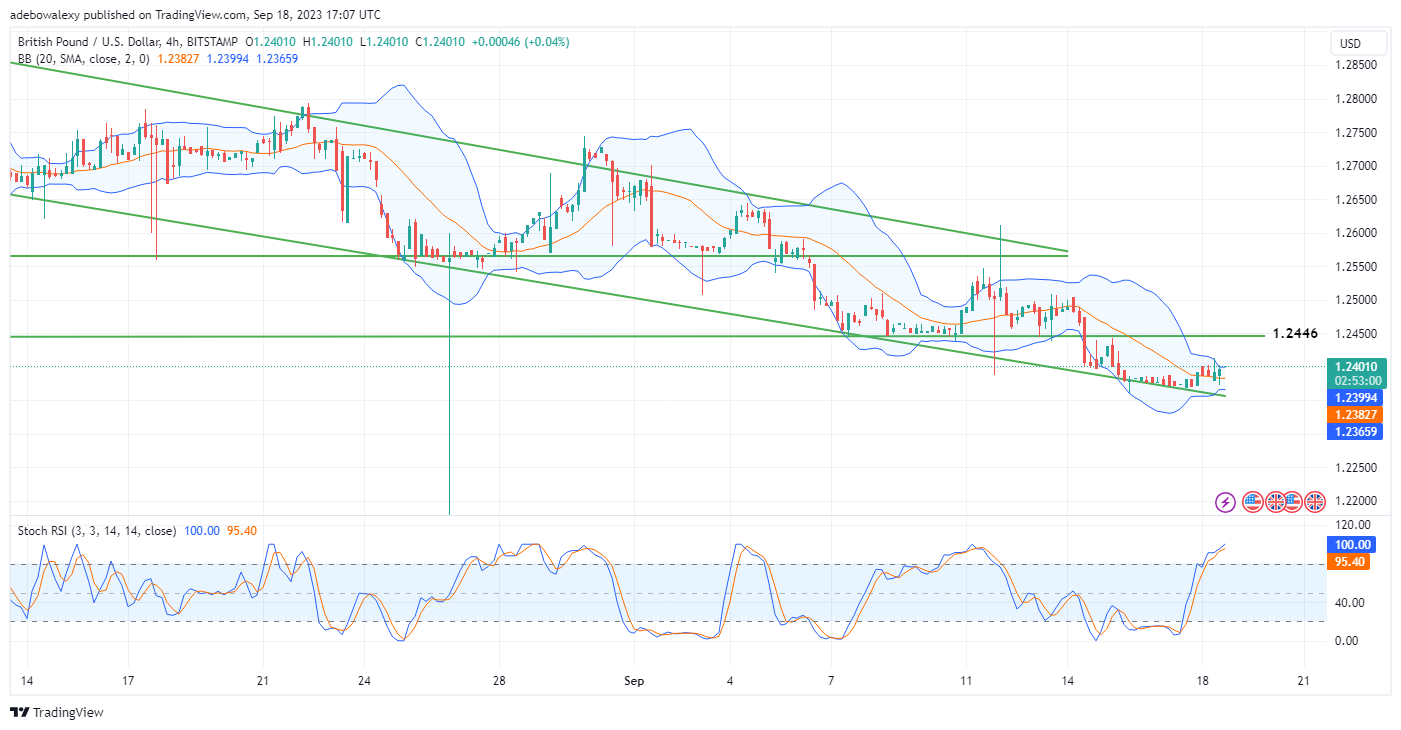
In the GBPUSD 4-hour market, technical indicators seem to be pointing out that long traders are gathering momentum. The price candle for the ongoing session can be seen appearing atop the middle limit of the Bollinger Bands.
Also, the Bollinger Bands can be seen narrowing up at this point, which suggests that prices may move significantly in a specific direction shortly. Additionally, the RSI lines are still rising upwards and towards the 120 mark. Although this appears too sensitive, it still shows that this pair will rise, at least, towards the 1.2450 mark.
Do you want to take your trading to the next level? Join the best platform for that here.


Leave a Reply