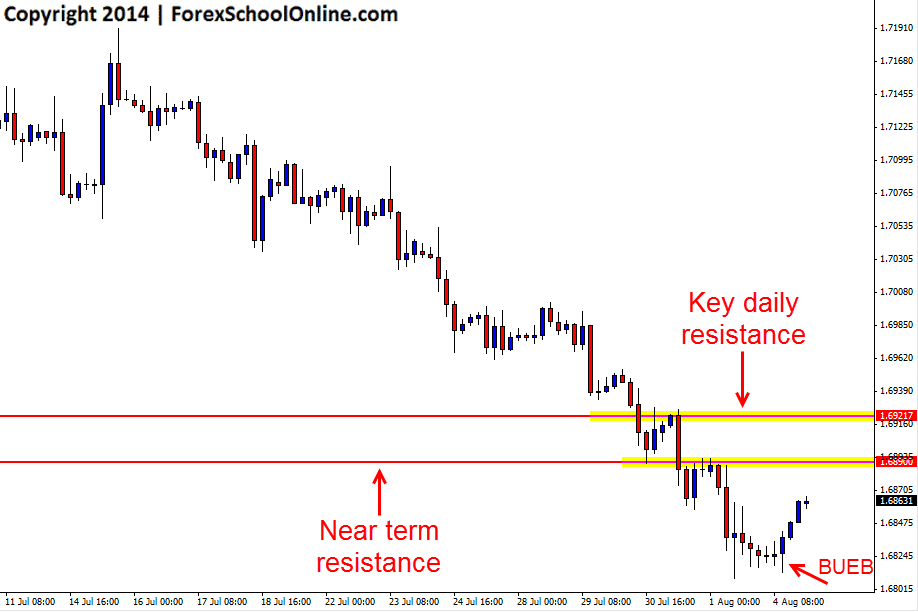
The GBPUSD has printed off a Bullish Engulfing Bar (BUEB) on the 4hr chart. The bullish engulfing bar is down at the extreme lows on the 4hr chart after price in recent times has made an extended move lower with lower highs and lower lows. Before firing off the bullish engulfing bar price started to stall with price trading sideways on the 4hr chart. This will often happen after large moves and can be a clue that price is getting ready to make it’s next big move and make a break out. In this case price traded sideways down at the extreme low with the engulfing bar then breaking out and engulfing the previous four candles.
To trade this 4hr bullish engulfing bar would be trading against the very strong recent down trend and momentum. Taking trigger signals at extreme lows or highs against strong trends is a low probability play unless there are other very strong reasons to do it. There can be some times where trading counter to the trend provides some very good trading opportunities, but trading from extreme highs and lows without major reasons to do it is a very low probability play.
A much higher probability play is using the information and trading with the strong move and trend and not fighting the move. Traders will always do better trading with the strong move, rather than trying to pick tops and bottoms and trying to trade against it. If price can break and make a move higher from this bullish engulfing bar there is then some areas traders can target within this down move on the 4hr chart to hunt short trades that would be trading within the recent downtrend. There is a 4hr swing point that is the first near term resistance before the major daily resistance comes in around the 1.6920 level as shown on the chart below.
GBPUSD 4hr Chart


Leave a Reply