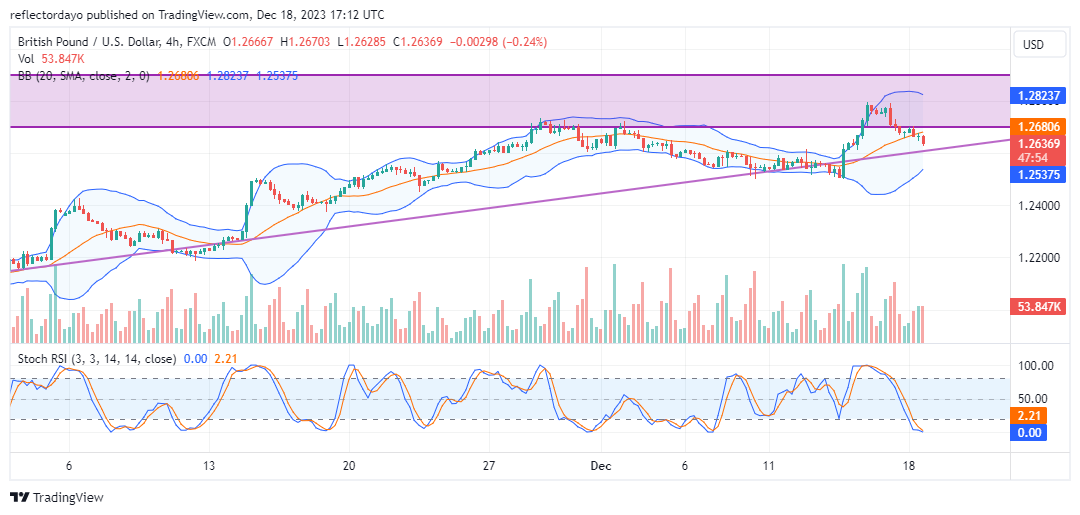
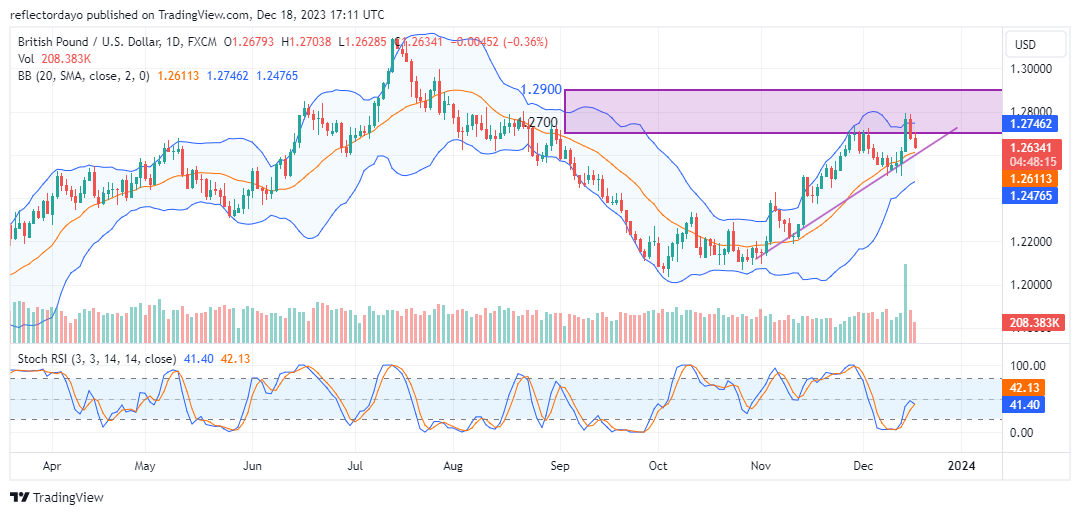
In the previous week, GBPUSD witnessed a considerable price increase, bringing prices close to the 1.2800 threshold. However, a negative bounce occurred during Friday’s trading session, pushing the price downward from the ceiling at the 1.2800 mark. Today’s trading has furthered this move, necessitating a closer evaluation.
Key Price Levels:
Resistance Levels: 1.2634, 1.2700, and 1.2800
Support Levels: 1.2600, 1.2500, and 1.2400
GBPUSD May Be Setting a Bearish Course
GBPUSD has been on the receiving end as the dollar has gathered significant traction since last week until now. The mood surrounding the US dollar may cause a further price decline in this market. On the daily chart, price action barely remains above the middle limit of the applied Bollinger Bands indicator.
Considering today’s price candle, it appears that it’s only a matter of time for price action to test this part of the Bollinger Bands. Additionally, the Stochastic Relative Strength Index (RSI) indicator has converged for a bearish crossover below the 50 mark, signaling that price action will likely see lower levels as we proceed into the week.

GBPUSD Bears Are Strengthening Their Grip
In the GBPUSD 4-hour market, price action has fallen clearly below the middle limit of the Bollinger Bands indicator. The price candle representing the ongoing session is more significant than those from previous sessions, implying that bears can gain more confidence, driving the market downward.
Observing the appearance of the Stochastic RSI indicator lines reveals that bears seem to have overpowered bulls since a trend reversal move has failed in this market. Despite the RSI lines reaching the lowest limit of the indicator, they still point downward, suggesting that price action may break down the support at the 1.2600 mark.
Do you want to take your trading to the next level? Join the best platform for that here.


Leave a Reply