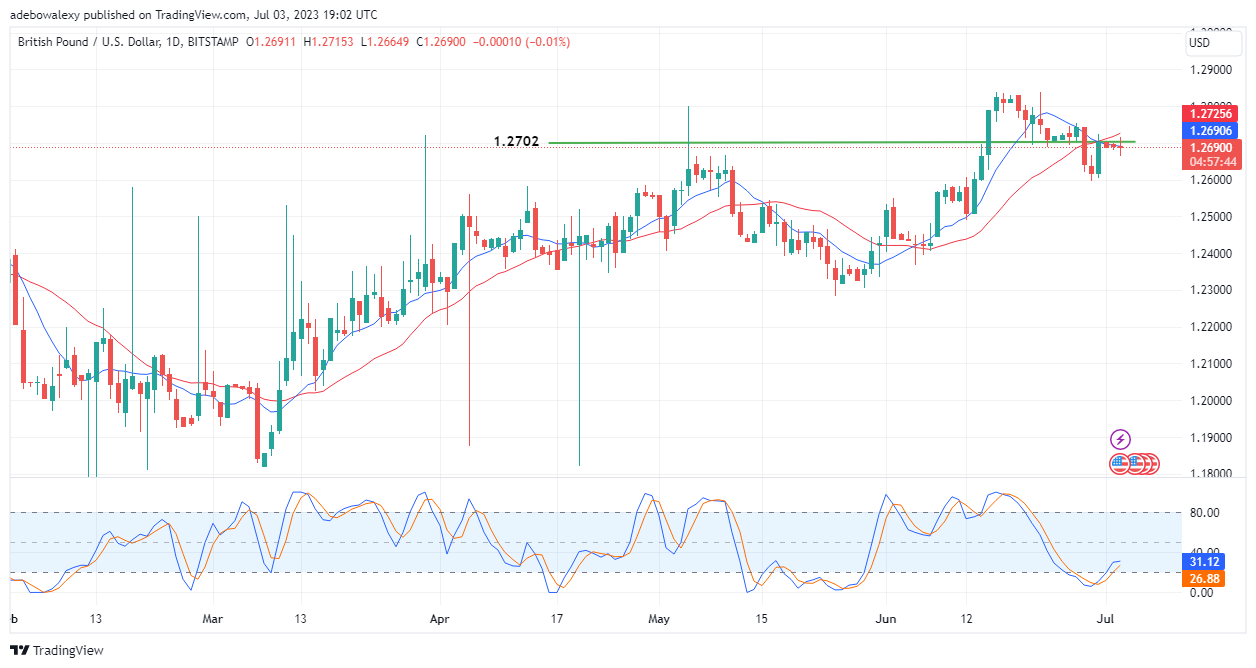
Price action in the GBPUSD has attempted to break the price resistance mark at 1.2702. Nevertheless, the resistance held, and price action corrected slightly. There are indications that this price resistance level will be quickly tested once more.
Major Price Levels:
Resistance Levels: 1.2700, 1.2750, and 1.2800
Support Levels: 1.2690, 1.2640, and 1.2600

GBPUSD May Crack the Price Ceiling at the 1.2702 Mark
The GBPUSD 24-hour market seems quiet as it lacks key fundamentals. Nevertheless, the last price candle on this chart lies approximately at the same level as the 9-day Moving Average curve. At the same time, the Relative Strength Index (RSI) indicator curves still have a generally upside-facing trajectory.
The terminal of the RSI leading line is now bent sideways due to the recent minimal correction of the resistance at the 1.2702 price mark. Even at that, any favorable fundamentals may send prices rising through the mentioned price mark.

GBPUSD Shows Upside Promise
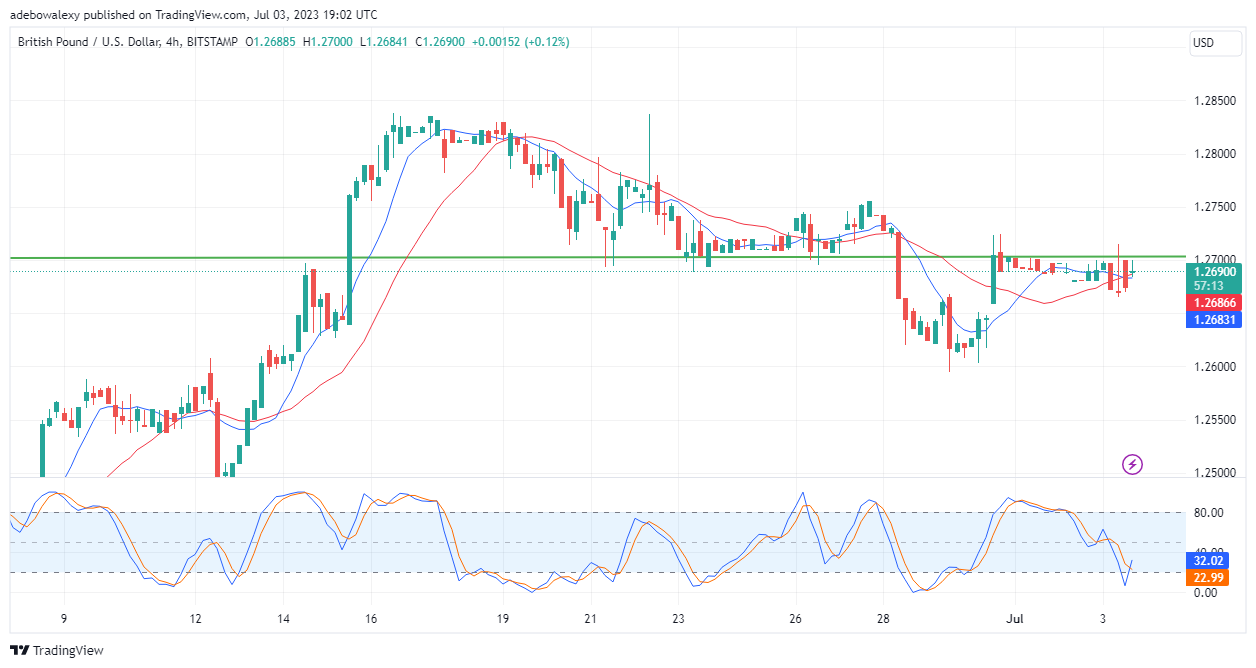
The GBPUSD 4-hour market is revealing that price action may be warming up to an upside move. A green price candle has just appeared above the crossover of the 9- and 21-day MA lines. Simultaneously, the RSI indicator has just performed a bullish crossover below the 40 levels of the indicator.
Consequently, all these imply that price action may gain upside traction and may break the nearby resistance at the 1.2702 mark. Furthermore, this may pave the way for more upside corrections towards the 1.2750 mark. Traders should watch out for any news coming from the pound front for more guidance.
Do you want to take your trading to the next level? Join the best platform for that here.


Leave a Reply