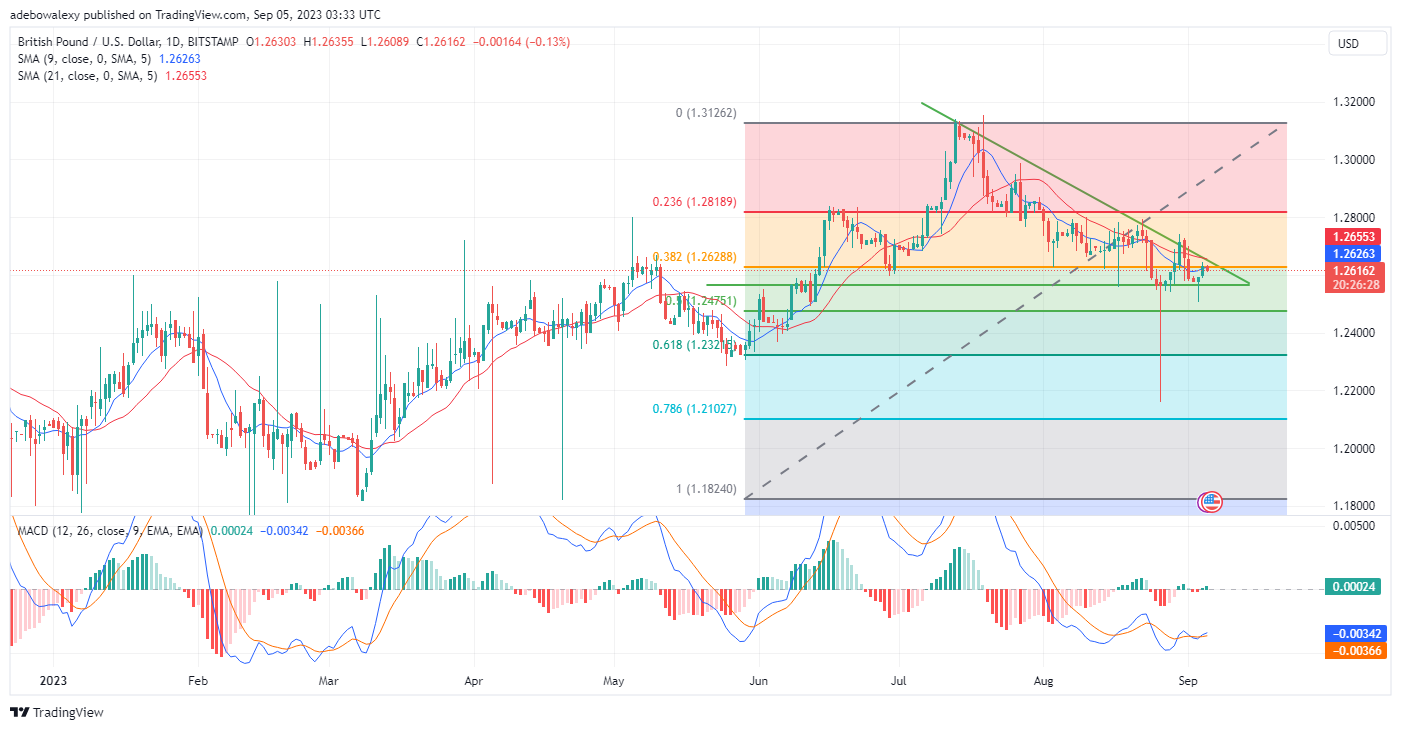
GBPUSD continues to trade below the 1.2700 mark, while most of the trading activity in recent times has been between the 1.2700 top and 1.2600 base levels. Meanwhile, examining price action on a much larger scale seems to reveal that it’s on a downtrend since it peaked at the 1.3130 mark.
Major Price Levels:
Resistance Levels: 1.2616, 1.2700, and 1.2750
Support Levels: 1.2600, 1.2550, and 1.2500

GBPUSD May Extend Upside Corrections Above the 1.2600 Mark
As earlier mentioned, the GBPUSD market appears to be generally in a downtrend, which started around July 14th. However, recently, the pairs seem to have come under pressure from headwinds, as recent trading activity has been occurring around the 1.2700 price mark.
But considering the trading pattern of late, it appears that bulls are preparing to challenge the medium-term resistance at the 1.2700 price mark. Likewise, the Moving Average Convergence Divergence (MACD) indicator has just delivered a bullish crossover under the equilibrium point. So, despite the appearance of a red price candle for the ongoing session, this seems to brighten upside hopes for this pair.

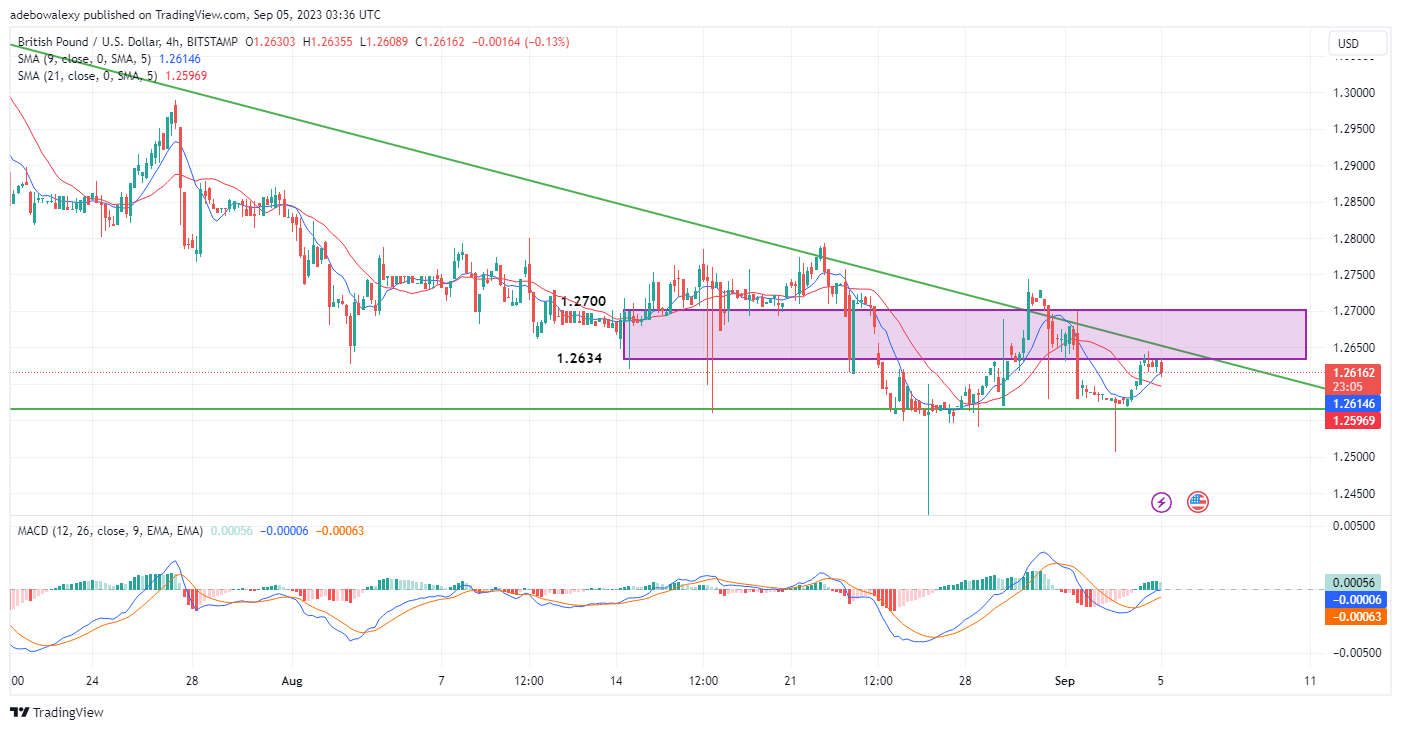
GBPUSD Is Facing Early Rejection Under the 1.2620 Resistance
Price action in the GBPUSD 4-hour market shows that buyers are already up against headwinds. This can be seen as the last price candle on the chart caused the last MACD indicator bar to arrive pale green. However, price action remains above the 9- and 21-day SMA curves, despite the appearance of the bearish price candle.
Consequently, this seems to offer buyers a fighting chance against the opposing headwinds. Should buyers be able to break the resistance at the 1.2620 mark, traders may gather gains towards the 1.2700 mark in the meantime.
Do you want to take your trading to the next level? Join the best platform for that here.


Leave a Reply