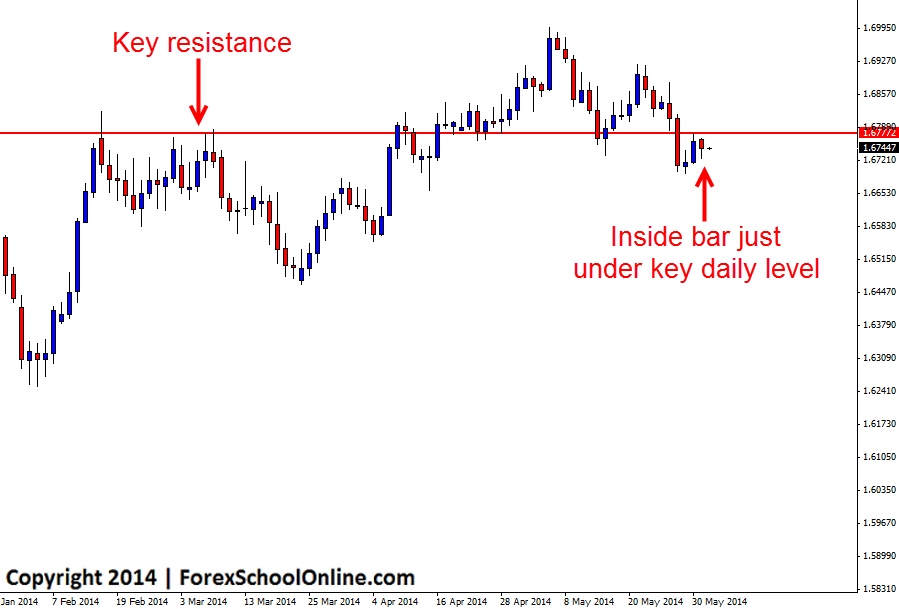
The GBPUSD has formed a price action inside bar on the daily chart. This inside bar is sitting just under what could prove to be a crucial level over the coming days and could decide where price moves if the levels holds or breaks. Price on the daily chart recently tested trying to break through the resistance level and failed and that is when the inside bar was formed as a sign that price was either taking a breather and getting reading for a possible attempt at the resistance again or a reversal lower.
In the May 29th Daily Forex Commentary we discussed this pair and how it was looking like an important move in the makeup for this pair when price broke through the key support level. We were also looking for potential short trades should price retrace back higher and into the resistance that price is now sitting underneath and should it show any bearish price action clues. Whilst price has retraced back into the new resistance price flip level as discussed in the May 29th commentary, price is as yet to fire off any solid or high probability quality bearish trigger signals that are confirming this level is in fact going to hold as a new resistance level and continue a potential new trend lower. As discussed in The Ultimate Guide to Marking Price Action Support & Resistance Levels price action traders are not pattern traders and they need to read the price action clues as the market prints the live price action onto the charts.
Which way this inside bar breaks is going to be important for the next overall move in this market. If price pops back above this support level and holds above, then traders can once again start looking for long trades, but if price makes a quick break lower, we may see the new trend lower continue.
GBPUSD Daily Chart


Leave a Reply