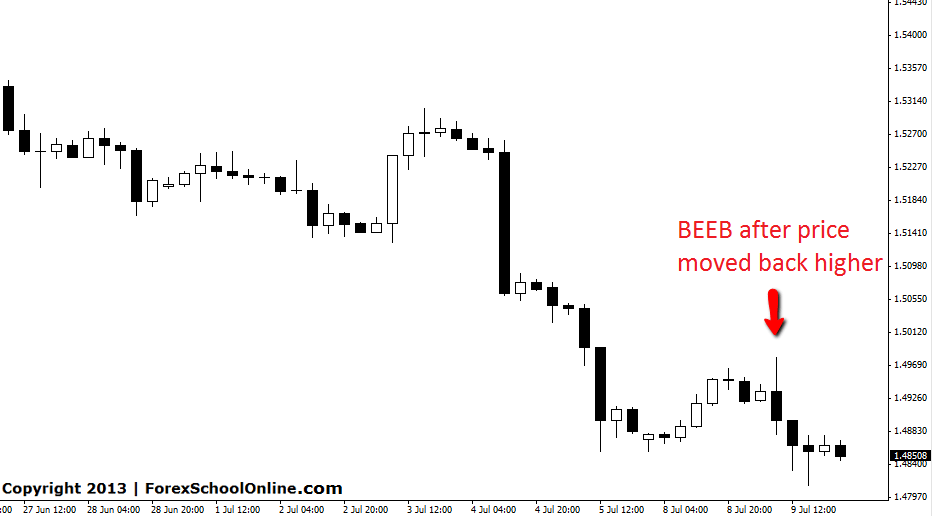
GBPUSD 4HR CHART
Yesterday on this blog we discussed the strong downward push on the GBPUSD and the logical resistance level that traders could look for short trades at should price rotate back higher and produce price action. To read yesterdays original post see HERE. During yesterdays session price moved back higher just shy of this resistance area and fired off a bearish engulfing bar (BEEB) before selling off and and moving back into the recent lows and giving traders on the ball a handy profit.
GBPUSD 4HR CHART | 10TH JULY 2013

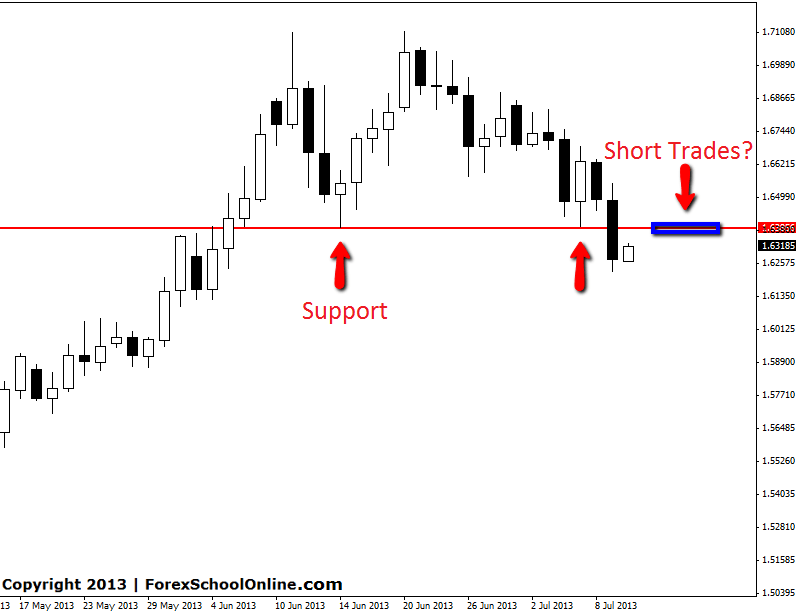
EURNZD DAILY CHART
The EURNZD has formed a double top before moving lower. This move lower has now grown some legs and overnight has broken a key support level on the daily chart. This daily support level is a proven level that has acted as both support and resistance on the daily chart in the past. Should price rotate back into this level traders could look to trade with the recent momentum and take short trades at a logical level. Taking short trades at this resistance level would be trading with the recent momentum and at a key level. Traders could look for trades on intraday charts to get into this pair should solid price action present.
EURNZD DAILY CHART | 10 JULY 2013


Leave a Reply