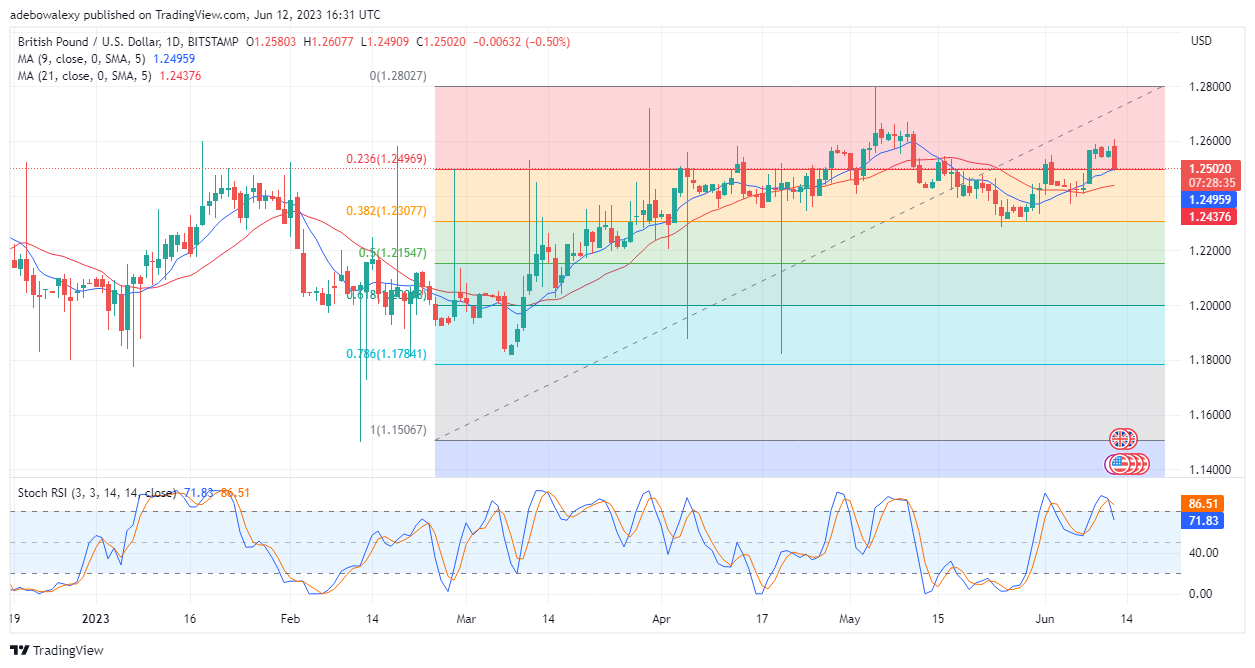
The GBPUSD pair seems sick of high altitudes after retracing very near the 1.2600 price mark. The current trading session has kindled bearish hope, and a strong one at that, as price action shapes to tear down support at the 1.2497 price mark.
Major Price Levels:
Resistance Levels: 1.2552, 1.2600, and 1.2650
Support Levels: 1.2502, 1.2452, and 1.2400

GBPUSD Set to Breakdown Support at 1.2497 Price Level
The dollar seemed to have strengthened as trading activities for the week resumed. This seems to have served as a headwind against the GBPUSD pair, causing a significant downward retracement in a session. The last price candle on the daily chart is already testing the support level at 1.2502. Meanwhile, the Stochastic Relative Strength Index (RSI) indicator is displaying that the downward retracement may be strong enough to tear down the identified support. This is because the line of this indicator has given a bearish crossover after reaching the overbought region. Following the crossover, the lines of the RSI seem to be falling steeply downward, suggesting that price action may proceed toward support levels.

GBPUSD Buyers Mount Weak Resistance at the 1.2502 Price Level
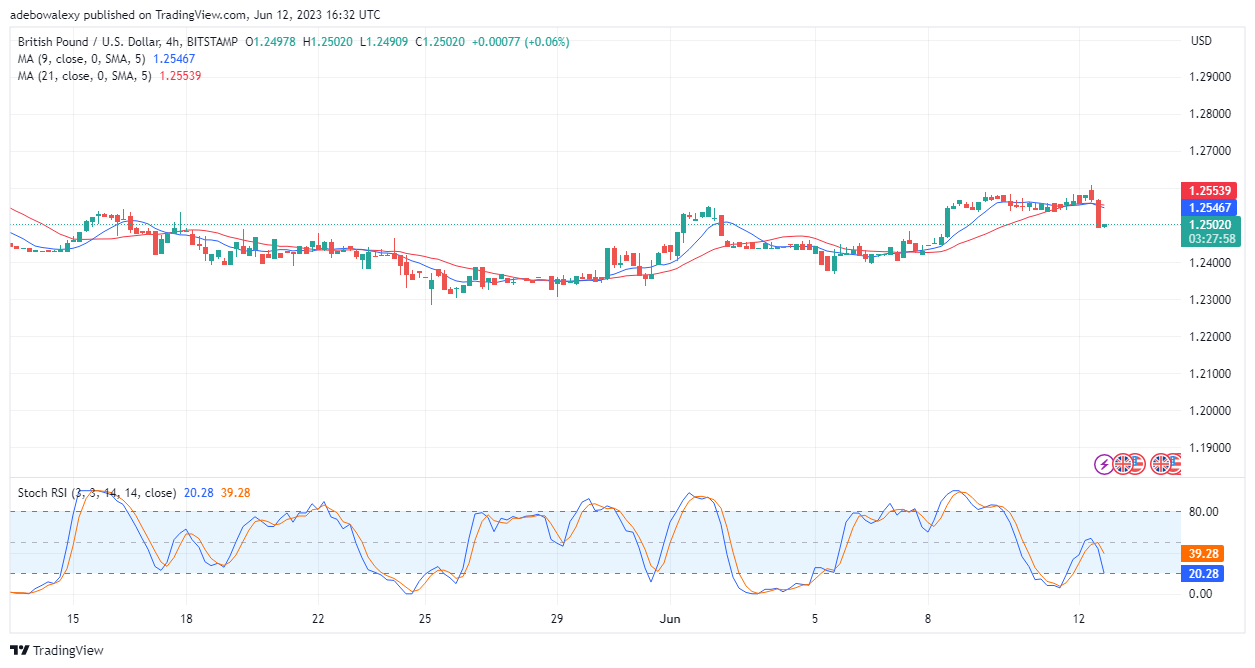
On the 4-hour chart, it appears that attempts are being made to resist further downward price retracements. This can be observed as a green but small-bodied price candle appears on this market chart. However, this resistance can be termed weak considering its size and since it has appeared below the crossover of both the 9- and 2-day Moving Average curves. At the same time, a crossover can be seen on the Stochastic RSI indicator, which suggests that the abating effort may fail and further downward retracements towards the 1.2400 price level may occur.
Do you want to take your trading to the next level? Join the best platform for that here.


Leave a Reply