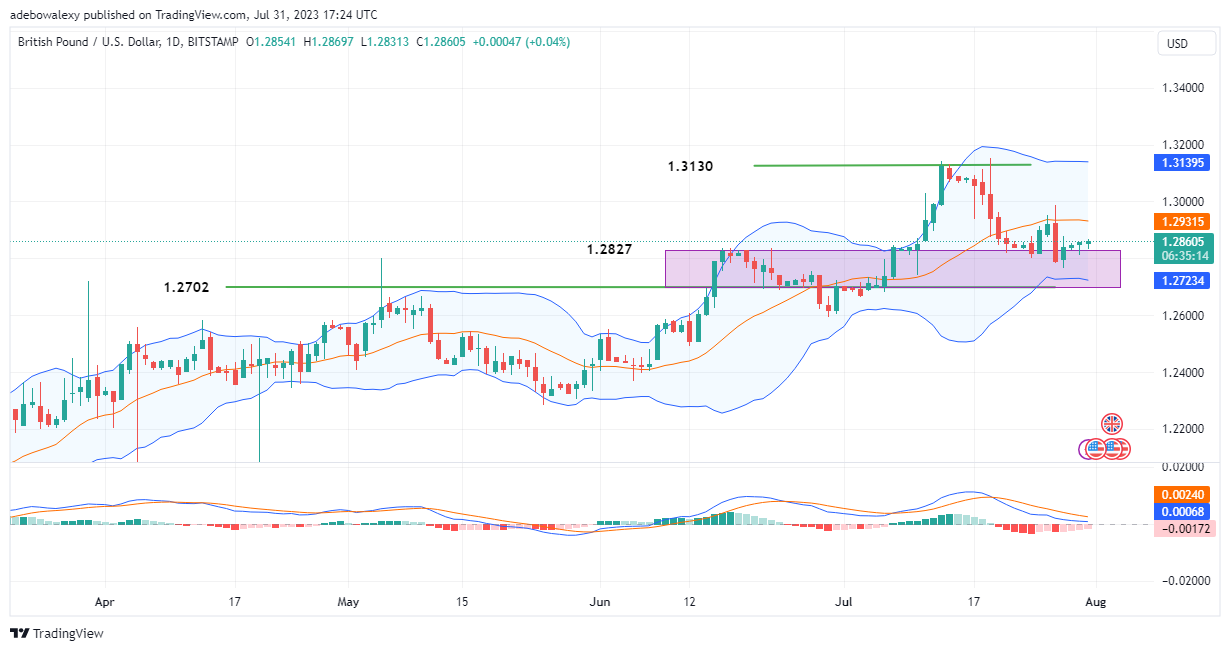
It was earlier predicted that price action in the GBPUSD market may sink below the 1.2800 price level in the previous week. And no sooner than price action tested this level, it bounced off it. However, this rebound isn’t that strong and seems to lack significant momentum. So, let us examine this market further.
Major Price Levels:
Resistance Levels: 1.2867, 1.2900, and 1.2960
Support Levels: 1.2850, 1.2810, and 1.2760

GBPUSD Presents Only Minimal Gains
After the GBPUSD pair rebounded off the 1.2800 mark, it has been continued in the upside direction. However, this upside correction seems to lack vigour considering the appearance of the last three price candles on this chart.
The lines of the Moving Average Convergence Divergence (MACD) are slowly turning sideways as their bars are now pale red. By implication, this signals a reduction in downward forces. Meanwhile, price action is still below the middle limit of the Bollinger band, which dampens bullish hopes, be that as it may.

Fundamentals Surrounding the GBPUSD May Be Strengthening
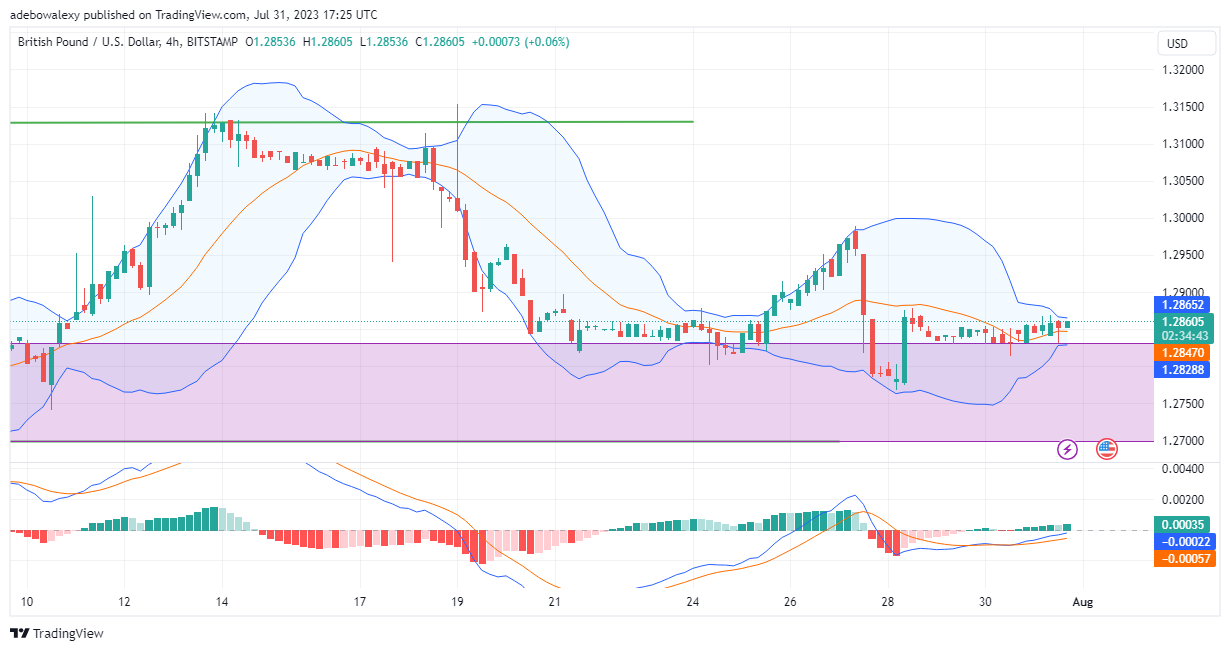
In the GBPUSD 4-hour market, indications coming from trading indicators seem to suggest that upside forces are gaining strength. The Bollinger Bands can be seen contracting while the last rice candle here is staying above the middle band of this indicator.
Furthermore, a careful look at the MACD reveals that the last bars of this indicator are now solid green in appearance. Simultaneously, the MACD lines are still rising steadily toward equilibrium level. All these signs are strengthening bullish hopes, and traders can anticipate an upward correction towards the 1.2900 mark shortly.
Do you want to take your trading to the next level? Join the best platform for that here.


Leave a Reply