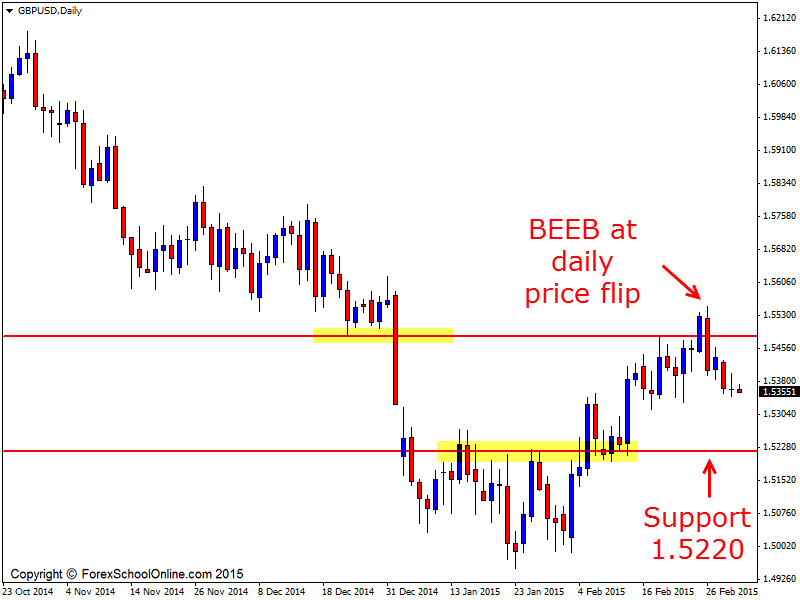
The GBPUSD has fired off a Bearish Engulfing Bar (BEEB) on the daily price action chart that could potentially send price much lower. This engulfing bar is rejecting a very strong price flip level that price had just previously held at as a support.
As the daily chart shows below; on the recent move lower, price paused and with this pause price found support. It is at this old support level that price is now finding a new resistance with the bearish engulfing bar. This is a super common and also very high probability market rule that repeats time and time again that you can use to hunt for your trades.
Price has now broken lower of the bearish engulfing bar to confirm and is sitting at a really interesting area. Price has halted at a minor trouble area where there is a minor support level. For a substantial move to occur, price will need to break through this trouble area. If this can happen, the near term support would then come in around the 1.5220 area.
As we teach our members in the members area; the engulfing bar can be a good setup to use different trade management techniques with. I can’t stress enough how this has to be done correctly and also with a plan because if you are not doing this consistently and the same way every single time, then your results will never be consistent.
GBPUSD Daily Chart


hello MR Fox
I want to know what do you use to see if price is overbought or oversold?
Senzo
Hello Senzo,
I just replied to this in the other thread here; https://www.forexschoolonline.com//the-2-bar-reversal/#comment-41791
I thought I had already reply to this, but you can find it now at the link above.
johnathon
There is an inside bar three candles before the BEEB. How would it affect the setup. Isn’t it risky a little bit to trade it when there is an inside bar that close?
Hello Janos,
we need to approach the chart from the point of view of the whole chart and as a “Price Action Story”, and not just looking at trigger signals or “setup” candles.
What I mean by this is that it is the story that can make an engulfing bar high probability, it is not the engulfing bar by itself that can be high probability.
Trigger signals by themselves tell us nothing and give us zero edge in the market. It is this overall price action that we need.
The inside bar is simply an indecision candle and as just explained above where it forms on a chart makes all the difference. Just because an inside bar forms does not mean two hoots. You will notice the candle just previous before this inside bar was a Bullish Engulfing Bar, but once again; it is about the overall price action story .
Safe trading,
Johnathon
First thank you for your reply.
As I learned from your post about inside bars. Inside bars can mean indecision but than the trend could continue as like in this case and the long BUEB before that would’ve signaled me that short term uptrend continues. Inside bars after indecision can turn around the trend too. So I would’ve waited at 1.5304 to get in the trade to make sure the BEEB surely signals downtrend.