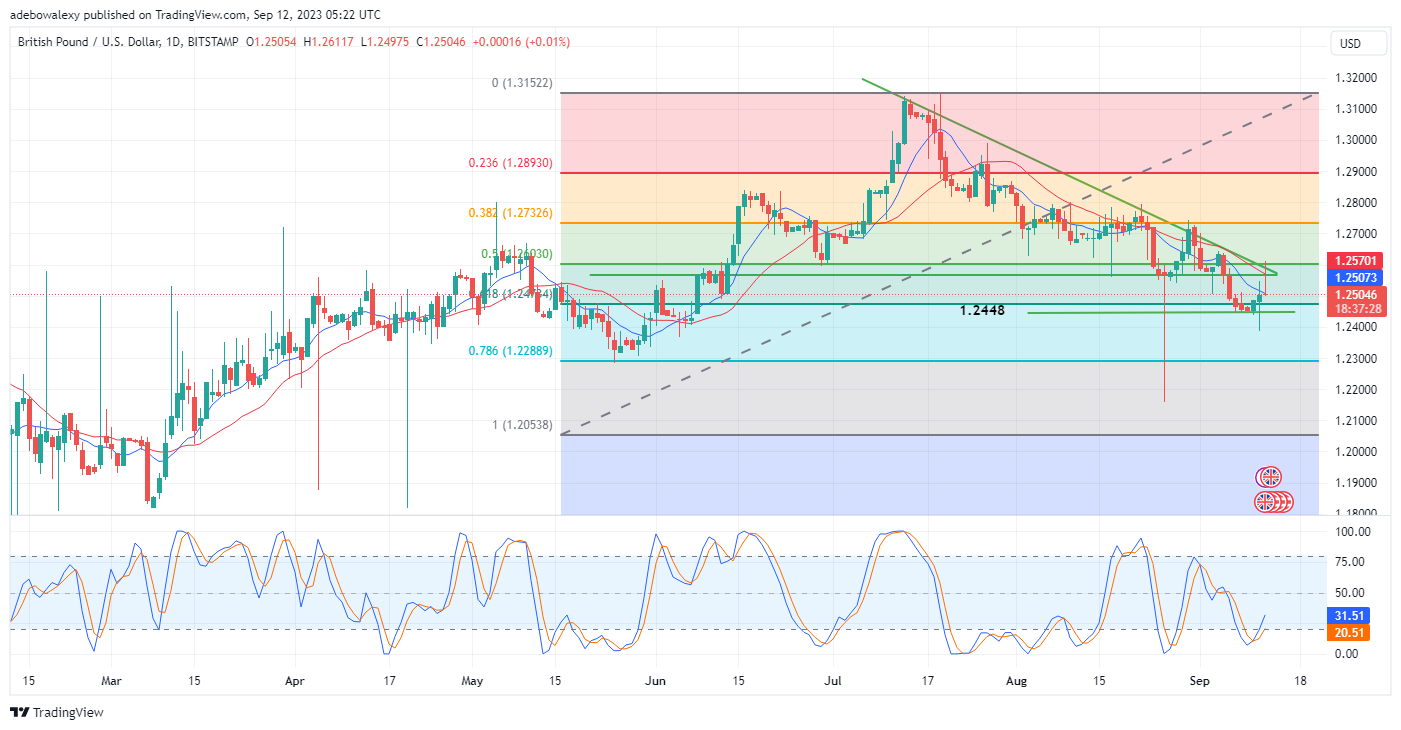
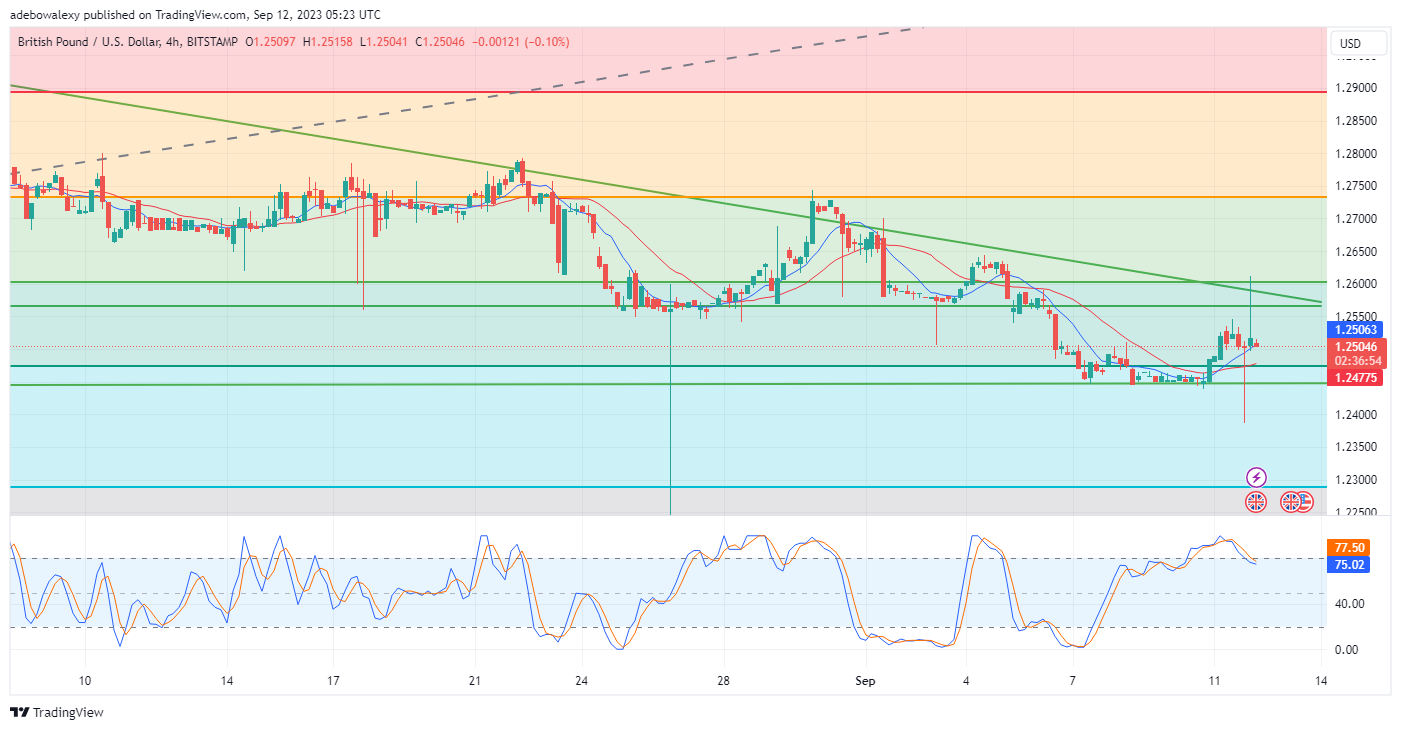
Since the past two trading sessions, swing traders in the GBPUSD market have been gathering moderate profits. However, this seems like one of those corrections in an overall downtrend, but trading indicators still maintain that more upside moves may yet be seen in this market.
Major Price Levels:
Resistance Levels: 1.2510, 1.2555, and 1.2605
Support Levels: 1.2505, 1.2470, and 1.2400

Upside Forces Look Stronger in the GBPUSD Market
There has been a consistent gain in upside momentum in the GBPUSD market for about two trading sessions, as earlier mentioned. This has given swing traders some profits. Furthermore, the Relative Strength (RSI) indicator can still be seen, indicating that momentum is still up as it keeps rising out of the oversold region. Nevertheless, it should be noted that a red-price candle has just appeared for the ongoing session. However, considering the size of this price candle, it shows that buyers are still in charge.

GBPUSD Downward Forces Are Appearing More Significant
The GBPUSD 4-hour market seems to have amplified downward forces. The last price candle in his market is a red one, sitting just atop the 9-day Smooth Moving Average (SMA) curve. Nevertheless, the last price candle still places the pair’s price above the 21-day SMA curve. Meanwhile, the RSI curves have been trending downward towards the 70 mark of the indicator.
But, taking a careful look at the terminals of the leading line, it could be seen that an upside crossover may be developing. The leading line of this indicator is now curved towards the lagging line in what seems like an attempt for a bullish crossover. By implication, this is pointing out that price action may still rise towards the 1.2550 mark.
Do you want to take your trading to the next level? Join the best platform for that here.


Leave a Reply