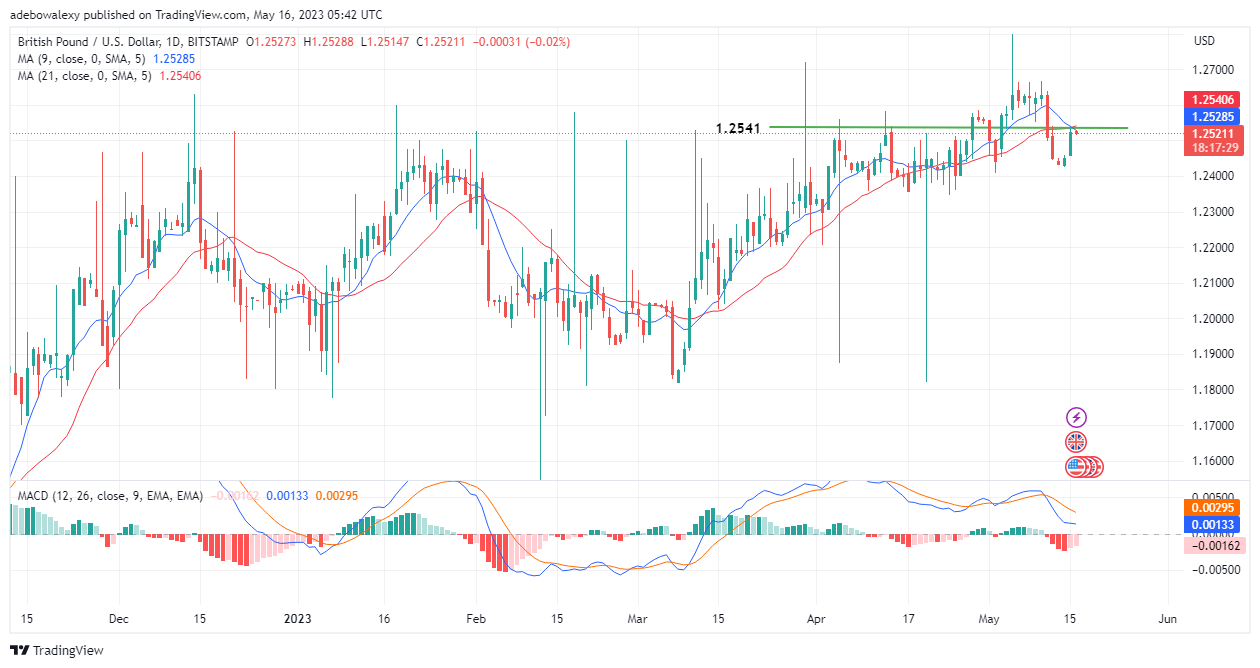
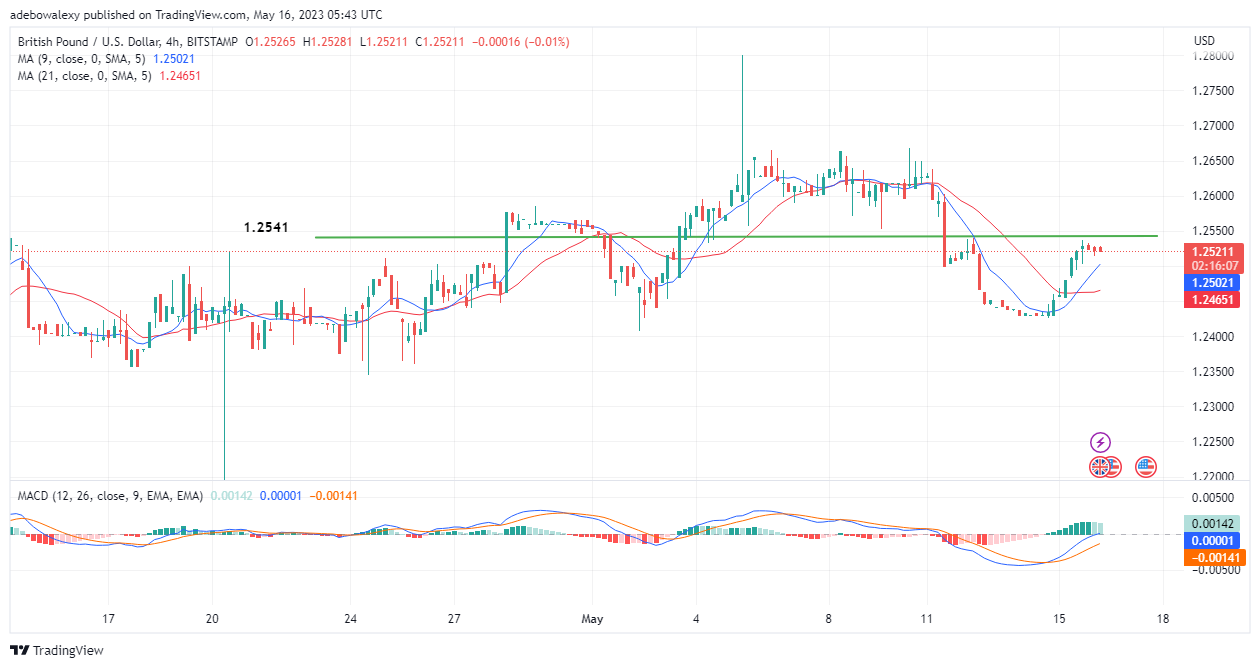
The GBPUSD price had earlier broken through 1.2541 in previous trading sessions. However, trading activities seem to have been acted upon by headwinds, which caused it to retreat below the already broken resistance. Also, very recently, there was a recovery over the past two trading sessions, which brought prices close to testing the 1.2541 resistance, but the ongoing session has encountered a headwind.
Major Price Levels:
Resistance Levels: 1.2521, 1.2550, and 1.2580
Support Levels: 1.2500, 1.2478, and 1.2450

GBPUSD May Have Started a Downward Retracement
In recent trading sessions on the daily market, GBPUSD price activity has started a retracement towards the resistance level at 1.2541. Nevertheless, the current trading session seems to have faced a strong headwind. This inference is drawn from the fact that the 9- and 21-day Moving Averages have performed a bearish crossover just above the last price candlestick. Meanwhile, the Moving Average Convergence Divergence indicator has been on a downtrend toward the equilibrium level from above it. Given the activities on the price chart, it appears that more price downward retracements may occur in this market.

Bears in the GBPUSD Market Are in Control But Not Finding it Easy to Exert Pressure
On the GBPUSD 4-hour chart, the perceived downward retracement has progressed. However, looking at the last red price candle here, it could be seen that the price candle for this session and the previous price held at the same level. Also, the MACD indicator bars have started to indicate that upside momentum is reducing, as they are now pale green. Nevertheless, it should be noted that price action remains above the crossed MA lines. Perhaps this is the resisting force against headwinds. Therefore, traders should anticipate that the price may advance toward 1.2541.
Do you want to take your trading to the next level? Join the best platform for that here.


Leave a Reply