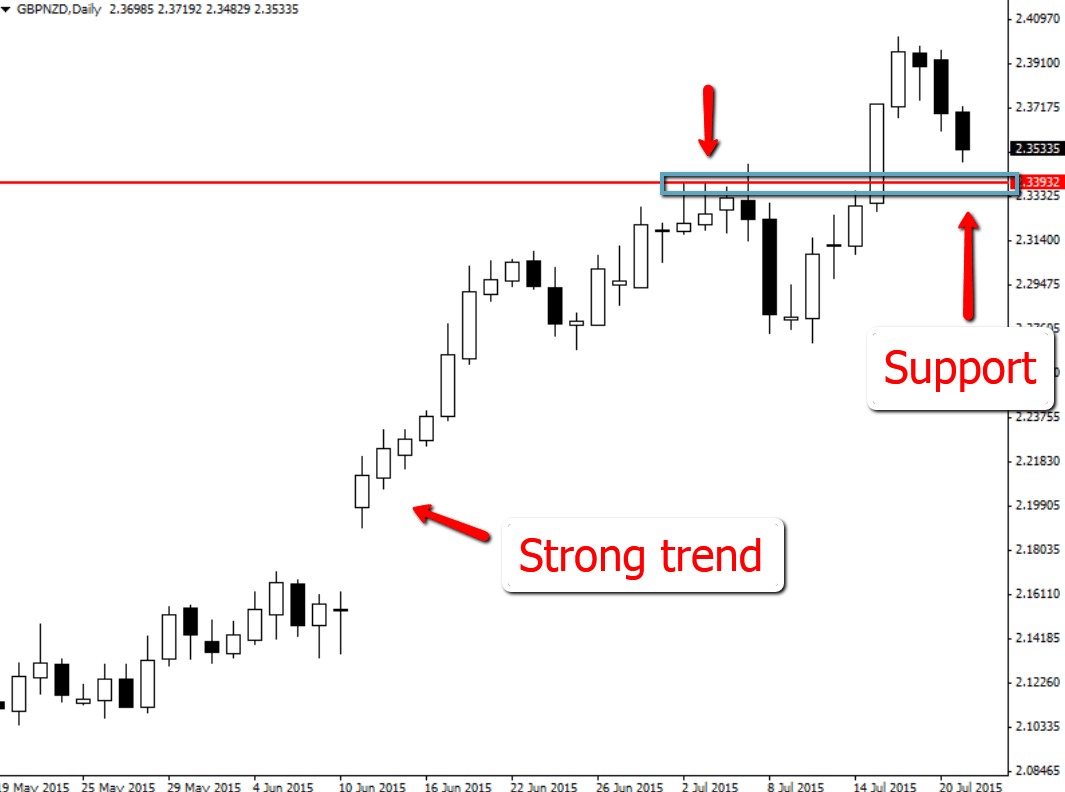
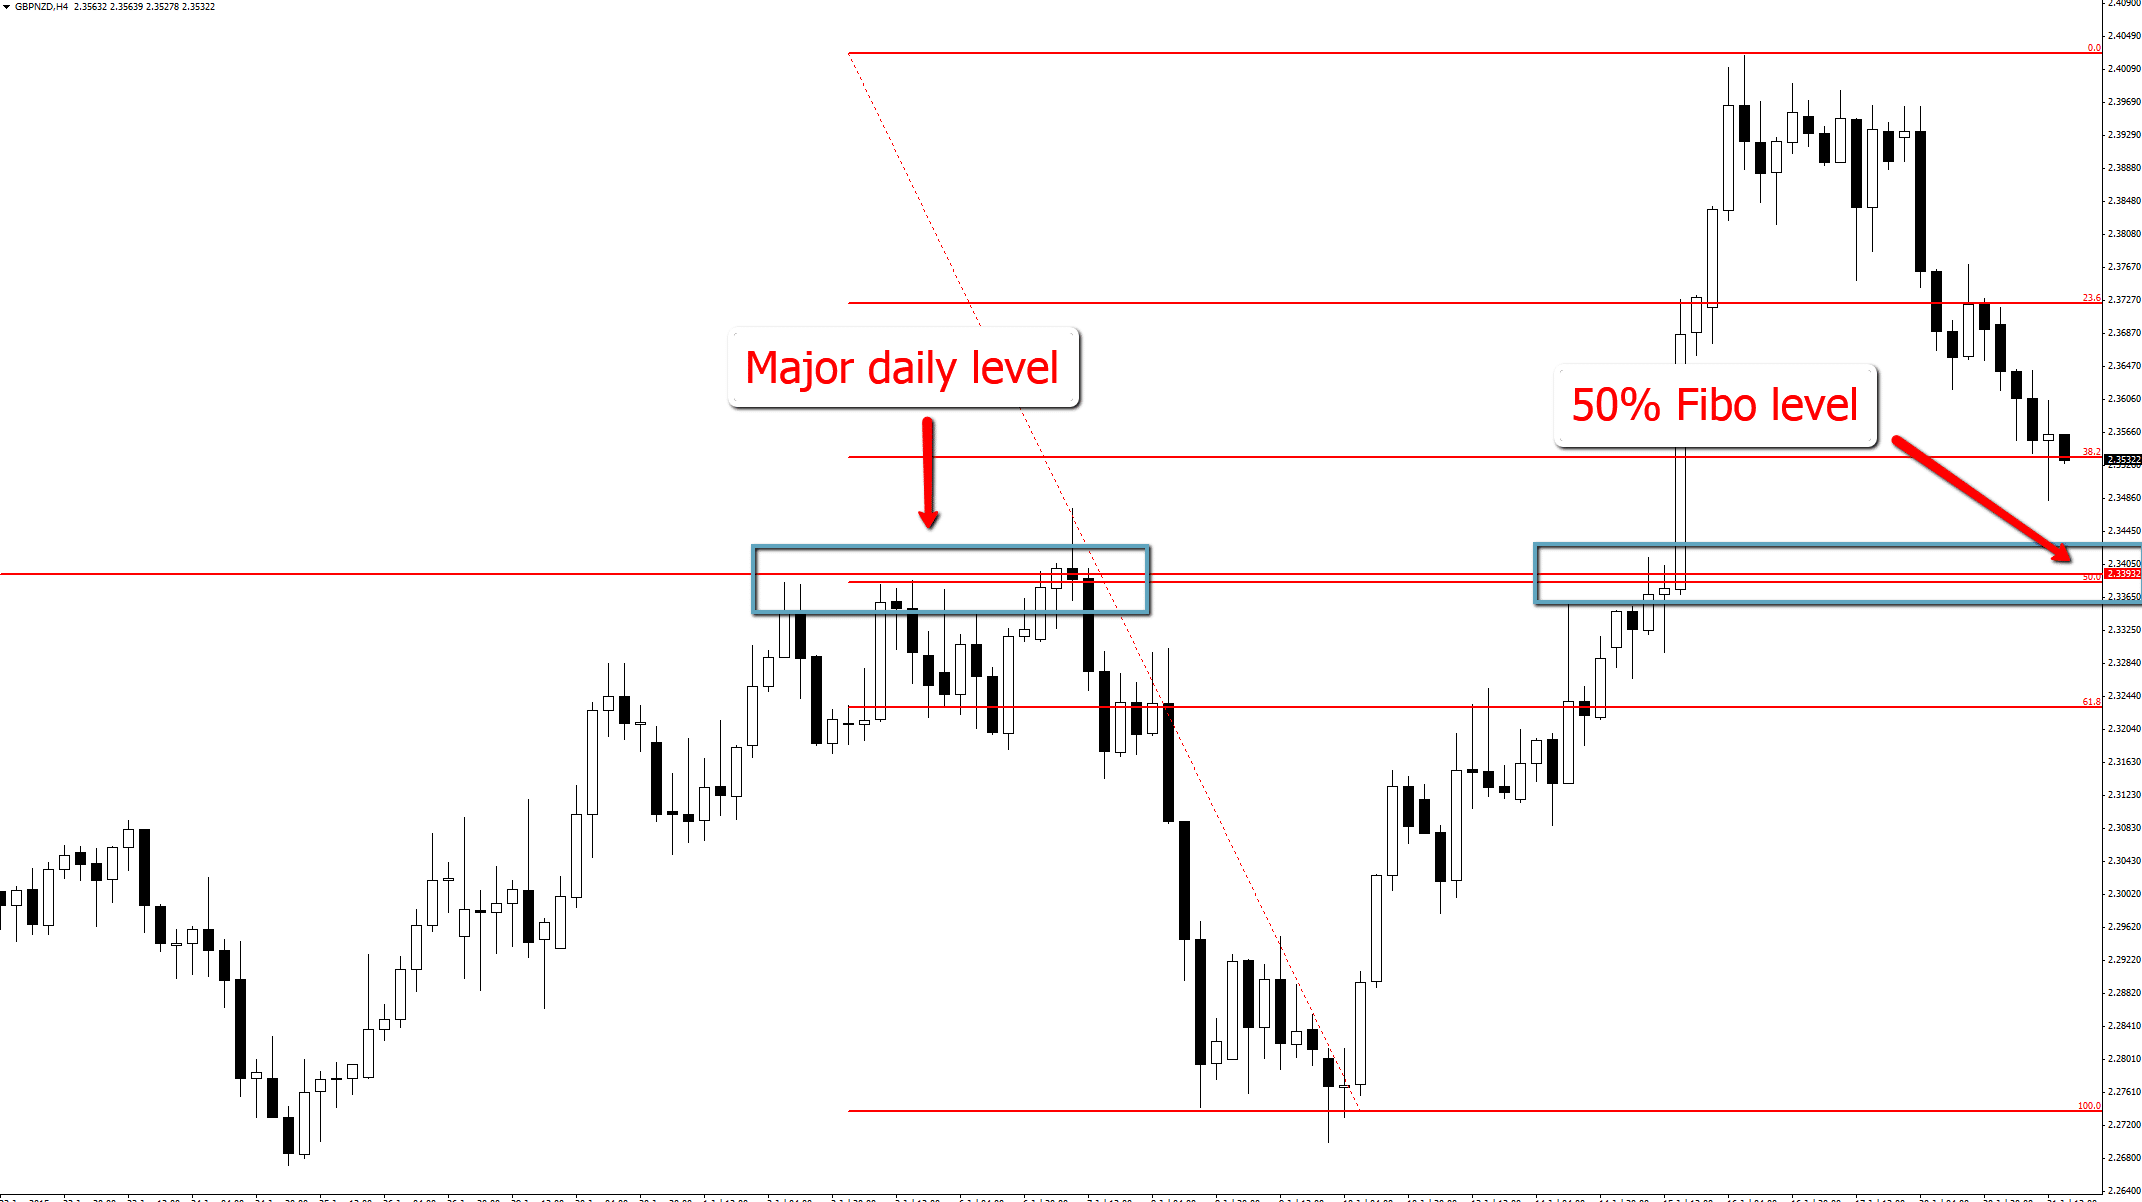
The GBPNZD has moved lower and now may make a move into the 50% Fibonacci retrace level inline with the super strong up-trend that has been raging higher in recent times. This strong trend has been pushing price higher and higher and has been creating higher highs and higher lows as is shown on the daily chart below.
As I write this up for you now, price is starting to retrace and rotate back lower to potentially move into the major daily support level that has previously acted as a resistance area. If this old resistance can act as a price flip and become a new support level, it could be a great area to look for bullish trigger signals to get long.
Getting long at this area would be getting long at a major daily support that is also inline with a very obvious strong trend higher and that is also at the 50% Fibonacci retrace point. To enter any long trades you would need to see high probability A+ trigger signals like the ones I teach in the price action courses. You can learn more about the price action course and all the members benefits here;
Lifetime Membership Price Action Course
GBPNZD Daily Chart

GBPNZD 4 Hour Chart


Hi Jonathan i noticed the daily candle bounced on 61.8% ,does that mean one can buy now?
Hi Aaron,
thanks for the comment.
As I mentioned in the post;
“To enter any long trades you would need to see high probability A+ trigger signals like the ones I teach in the price action courses. You can learn more about the price action course and all the members benefits here; https://www.forexschoolonline.com//lifetime-membership”
Any other questions please let me know in regards to this please let me know,
Johnathon