Before starting today’s post, let me answer a question I have been receiving of late in regards to the daily commentary. I post up a wide variety of Forex pairs and different markets, such as Stock indices, and Commodities; for example, Oil, Gas, and Gold & Silver.
Why do I trade such a wide variety of markets rather than only having a watch list of a handful? It is quite simple. I want to be able to “Cherry Pick” the very best A+ trade setups from a wide range of markets rather than only watch 4 or 5 pairs and feel that I am being forced to trade or have to come up with trades because there is nothing there to trade.
Often, you will see traders making up trades or staring at the charts for far too long, trying to invent trades where there really just is not a trade there to be made and the simple reason is because instead of just cherry picking the best trades, they are forcing the market and this is not what we want to be doing. If you have any questions on this, just pop them in the comments below.
You can read about the markets and Forex pairs that I trade in this trading lesson here:
The Forex Pairs & Markets Johnathon Fox Trades
If you want a broker that trades all the markets I discuss in my daily posts, then check out this post here; The Charts & Broker we Recommend For Price Action Traders.
GBPJPY Daily Chart
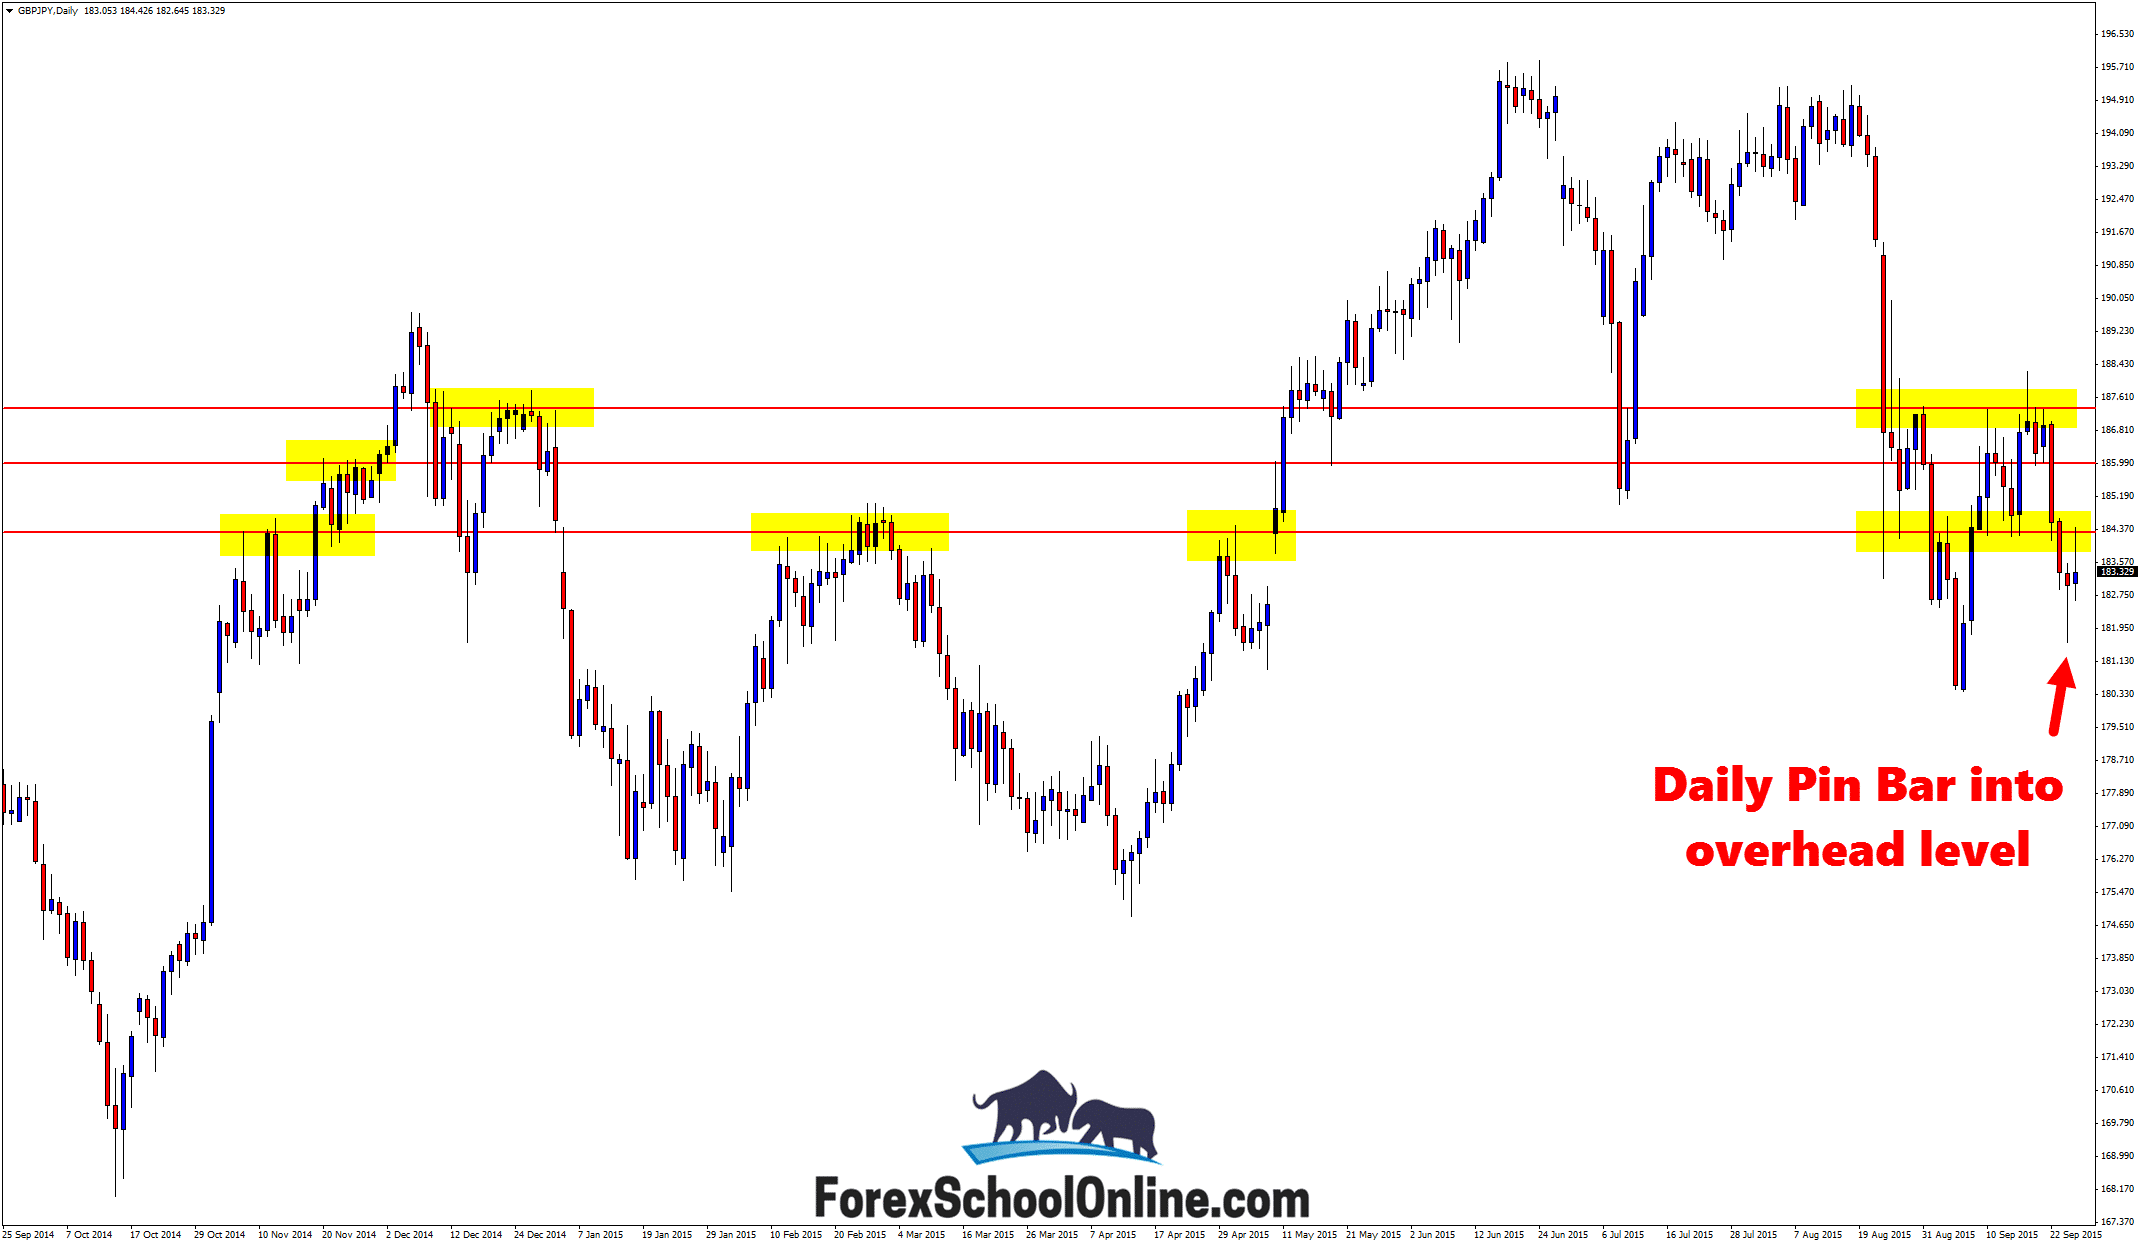
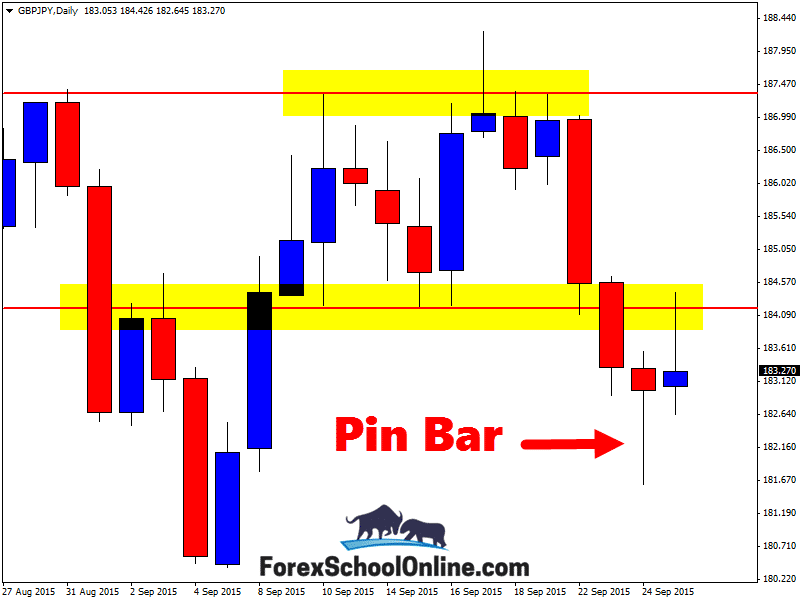
The GBPJPY has now moved higher and into the near term resistance that was sitting super close overhead after breaking higher and confirming the pin bar reversal on the daily price action chart. This daily pin bar reversal had a long nose that was protruding out and away from all other price, as the two charts below both show.
The other thing about this pin bar was that the nose was rejecting a major key support level. Price had moved lower and into the daily support to try and make a break lower. Price on the daily chart of this pair has been all over the shop of late, but price was attempting to make a break lower and a potential test of breaking the support level. Price however, held at the support and with price snapping back higher, it formed the nose of the pin bar.
It is going to be super interesting for price action traders where price goes from here. The resistance that price is now testing is a major daily level. If price can gain some momentum and break higher, there is then space to move higher into.
If price falls back lower, then we could potentially see the start of a fresh leg lower with the next major daily support coming in around the 180.65 level.
Daily Chart – Overhead Resistance

Daily Chart – Pin Bar Reversal


Heya Josephkee,
yes the odds were always on price moving lower.
We had the strong recent momentum to the downside and that major resistance and that is why I went no where near that pin bar.
My thinking on that pin bar was that once price broke the high it was a very high chance to break higher, but once it moved into the overhead resistance it was going to be hard to move any further from there.
Safe trading,
Johnathon
Its a strong area of demand as you can see slightly left strong bearish dropping down from the supply area on top.
Possible reversal from the pin bar but at this time the price seems to be dropping a little.