Market Analysis: GBPJPY Displays Bearish Signals and Potential Downtrend
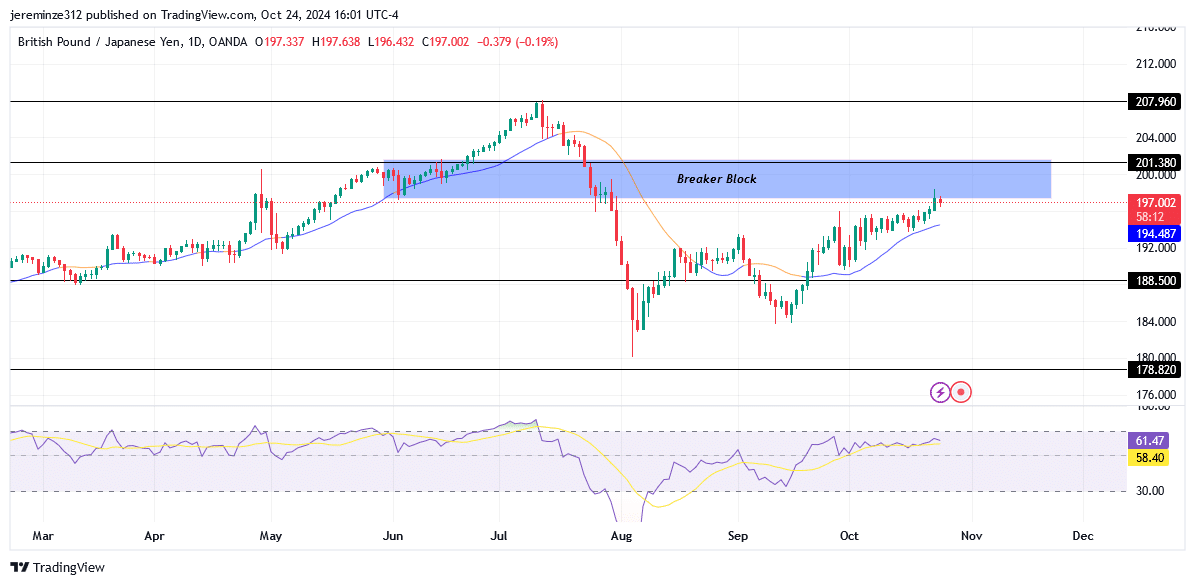
Following the bearish trend that GBPJPY price has experienced since reaching its major high of $207.960, the pair saw a notable bullish pullback beginning in early August 2024. This temporary upward correction has now approached a key resistance zone, and recent price action suggests the bullish momentum may be weakening. As of the current market level, bearish indicators are gaining prominence, signaling a potential reversal back into the broader bearish trend.
GBPJPY Significant Zones
Resistance Levels: 207.960, 201.380
Support Levels: 188.500, 178.820
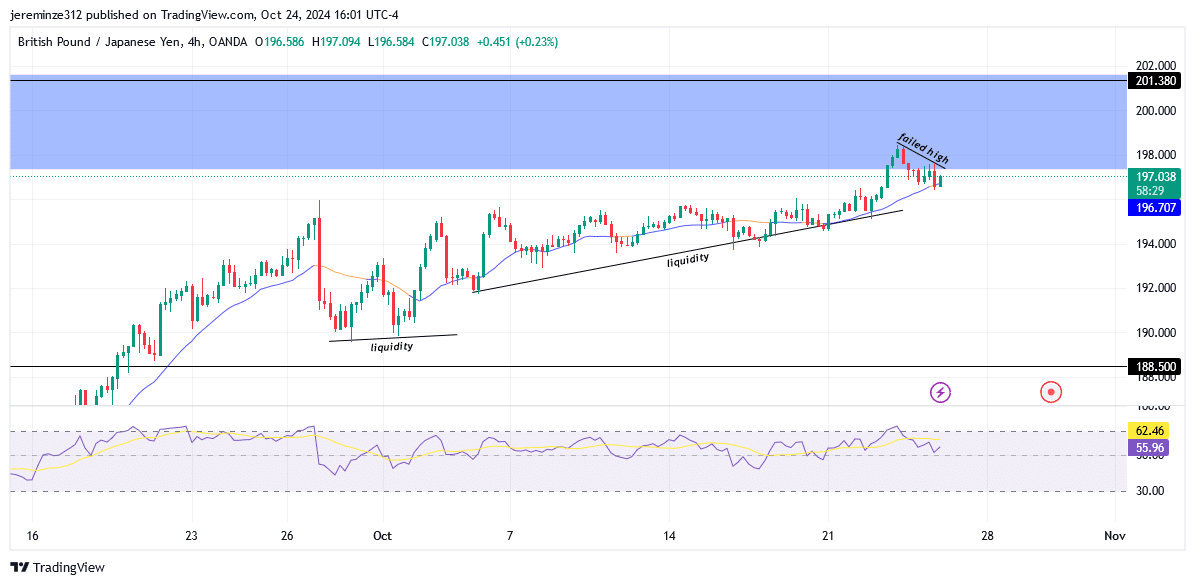
The daily chart reveals that price has triggered a key daily breaker block, a technical level that typically acts as a resistance point within a bearish trend. This interaction with the breaker block was accompanied by a failed high, indicating a weakening of the bullish trend and a lack of sustainable higher highs. This failure suggests that GBPJPY buyers are losing control, and the bearish signals are starting to dominate.
One of the most notable factors reinforcing the bearish outlook is the liquidity resting below the current market price. In technical analysis, liquidity zones often act as magnets, drawing the price towards them. The existence of significant liquidity beneath the market indicates that the price is likely to move lower in search of this liquidity, further supporting a bearish scenario.
In addition to the price action signals, the daily Relative Strength Index (RSI) shows that the pair is in the overbought region. This suggests that bullish momentum is starting to weaken, and a reversal could be on the horizon. Similarly, the 4-hour RSI also indicates an overbought condition, reinforcing the signals from the daily chart and suggesting that the market may soon experience a downturn.

Market Expectation
Both the daily and 4-hour timeframes are presenting bearish signals. The expectation is for the price to react aggressively to the daily breaker block and continue its downward move, breaching below the daily Moving Average. A breach of the Moving Average would further align the price action with the ongoing bearish trend and could set the stage for a more significant decline. This would be taken account of in the best forex signals.
Note: Forexschoolonline.com is not a financial advisor. Do your research before investing your funds in any financial asset or presented product or event. We are not for your investing results.


Leave a Reply