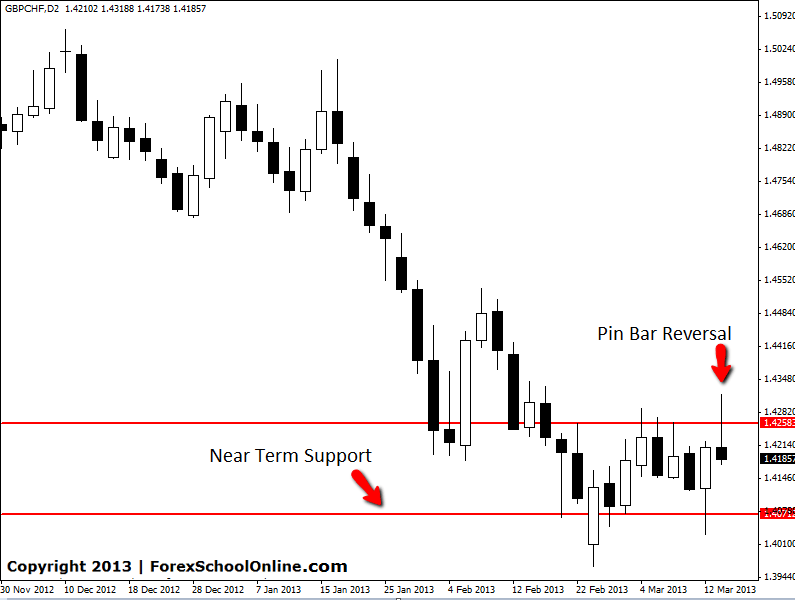
The two day chart of the GBPCHF has formed a bearish Pin Bar Reversal. This Pin Bar is formed rejecting the recent resistance level and is also formed in-line with the recent trend which has been lower.
The near term support level for this pair comes in fairly close below around the 1.4070 level. If price can manage to push lower and take out the lows of the Pin Bar, a push into the near term support level could be on the cards. If however the bulls come in to take price higher, the resistance level that the Pin bar is rejecting is the next level for price to attack. If price can manage to break the resistance zone, the down-trend could be over for the short term future.
The chart below highlights the Pin Bar and also the relevant support and resistance levels. The MT4 charts that Forex School Online and it’s members use do not automatically carry the two day charts. To form a two day chart with MT4 an indicator is required. If you would like to know how to change your MT4 charts to make any time frame you like, see this article which discusses not only how make any time frame, but also the recommended candle times to use for accurate trading: New York Close Forex MT4 and Change Time frames
In our most recent article we discussed how traders can identify trending markets and then how to trade with-in them using raw price action. If you would like to read this in depth tutorial on trend trading see here: Trend Trading Forex | In Depth Tutorial.
GBPCHF TWO DAY CHART | 17TH MARCH 2013


Leave a Reply