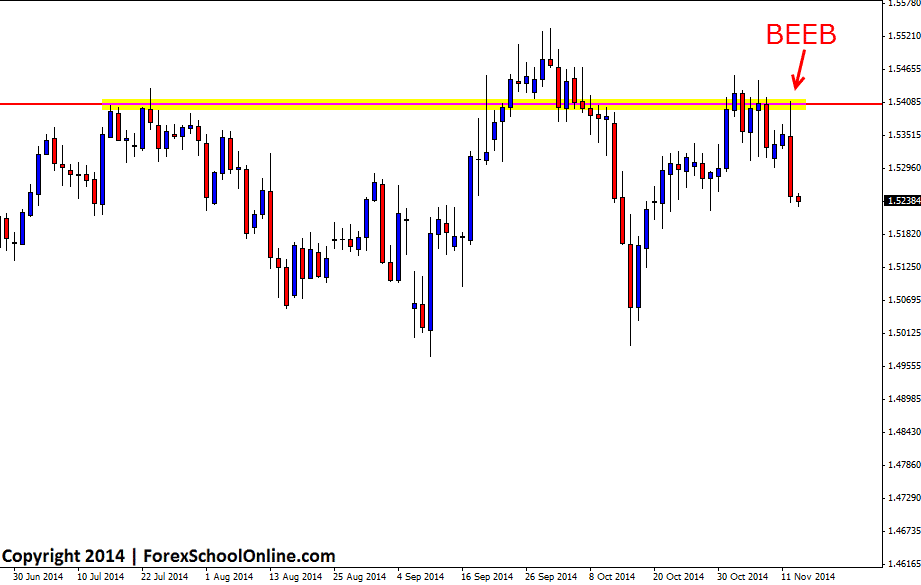
The GBPCHF has printed a large Bearish Engulfing Bar (BEEB) that is engulfing the previous two candles on the daily price action chart. This has been an interesting chart of late because after firing off a bullish 2 day pin bar off of the recent lows, price ground it’s way higher back into the major highs that price has really struggled to move past in recent times.
At these recent highs price was consolidating and trading sideways with price really not doing anything of note. Price was trading on the spot, making a move up one day and a move down the next. Price has now printed this Bearish Engulfing Bar which has a larger daily range than any of the previous 19 candles on the daily chart going right back to the swing lows where price was rejecting the recent support levels.
There are some minor levels straight below this engulfing bar that could act as support levels or trouble areas for price moving lower, but if the engulfing bar can be confirmed and price can break and gain momentum, the next major support level looks to come in around the 1.5175 level before the 1.5120 area where the 2 day pin bar was rejecting.
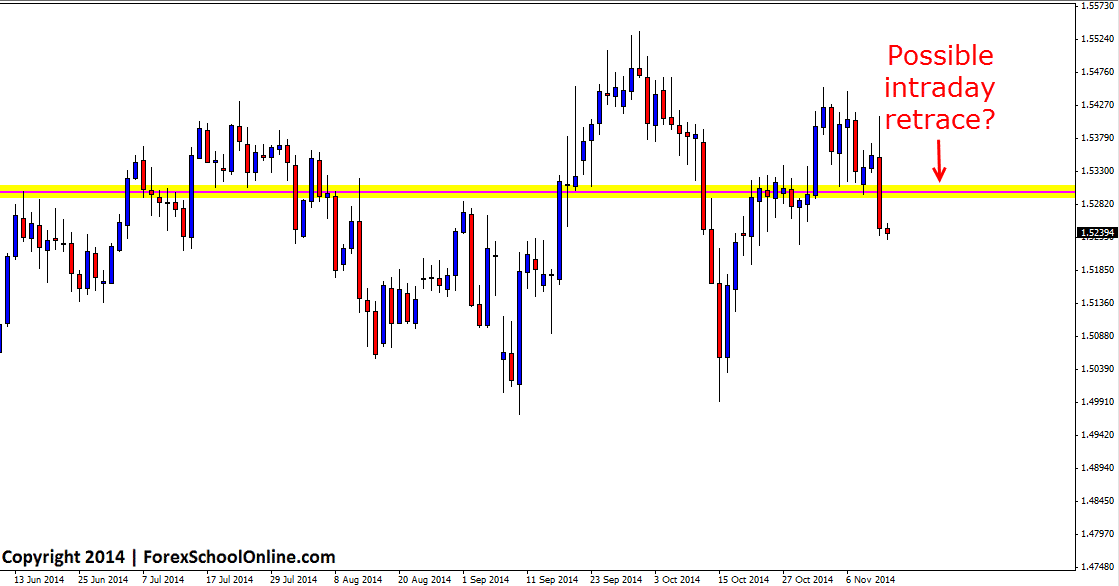
For intraday traders who are bears in this market and are looking to trade from key daily levels, this BEEB has broken and closed below multiple key daily levels. This could provide for a potential intraday retracement and reversal trade should price rotate back higher. As the second chart shows below; their is a key daily resistance level that price could rotate higher into and if this happens traders would need to watch the price action behavior to see if the level is going to hold as a new price flip resistance level and to also watch for any high probability price action trigger signals on their intraday charts.
GBPCHF Daily Chart

GBPCHF Daily Chart – Price Flip Daily Level

Related Forex Trading Education
– How to Trade Price Action From Kill Zones & Price Flips


Leave a Reply