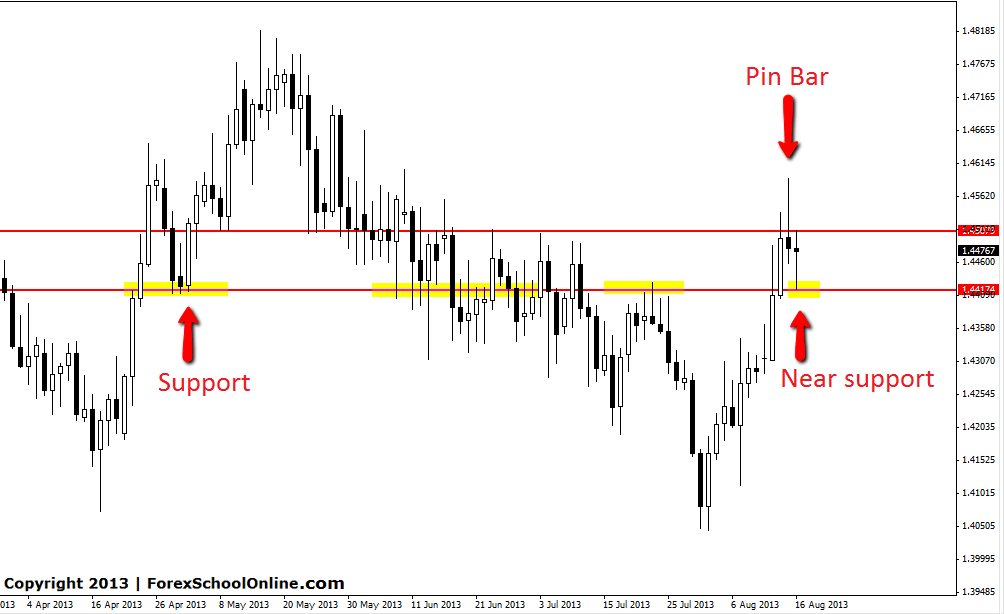
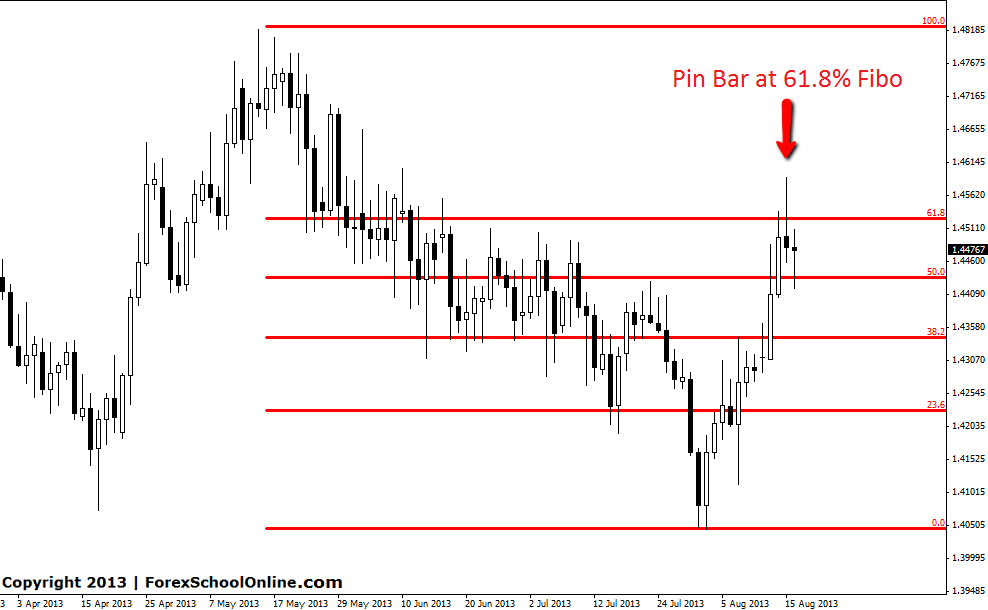
Price on the GBPCHF has closed a few pips lower than it’s daily open after forming a large daily bearish Pin Bar. This daily Pin Bar created a quick chance for savvy traders to make a profit after price moved lower and into the near term support, before the bulls jumped back in and price snapped back higher.
This market is very choppy and price is trading in a clear sideways range. The majority of candles on the daily chart are indecision candles with a lot of them showing wicks on the ends. This indicates that neither the bulls nor the bears are in full control and that there is no trend or clear momentum in play. This is very important for traders to know because when trading in range bound markets such as this one, the likelihood of price whipsawing or snapping back the other way is much higher than compared to when making trades with the trend.
This daily Pin Bar was formed up at a high and rejecting a solid level that had acted as both support and resistance in the past. The level this Pin Bar was formed at was also in-line with the 61.8% Fibonacci level from the swing high down to the swing low. The second chart below shows this Fibonacci level. This same support/resistance level also was a Very Big Round Number (VBRN) in 1.4500. When we have a VBRN that lines up with a key support or resistance level they can act as a major psychological level and in this case the VBRN is lining up with the support, resistance and the Fibonacci level.
After price broke the low of the Pin Bar it moved straight into the near term support. This move was direct and quick. Just as quick as price moved lower into the near term support, it found some buyers and retraced back higher into the low of the Pin Bar. As I write this post, price is sitting a few pips below the previous daily candles opening price.
For price to move higher it is going to have to move through the resistance that price failed to break out of when it made the Pin Bar through the VBRN in 1.4500. To move lower price is going to have to move through the near term support that price tested and could not break on Friday.
GBPCHF DAILY CHART

GBPCHF DAILY FIBONACCI CHART


Leave a Reply