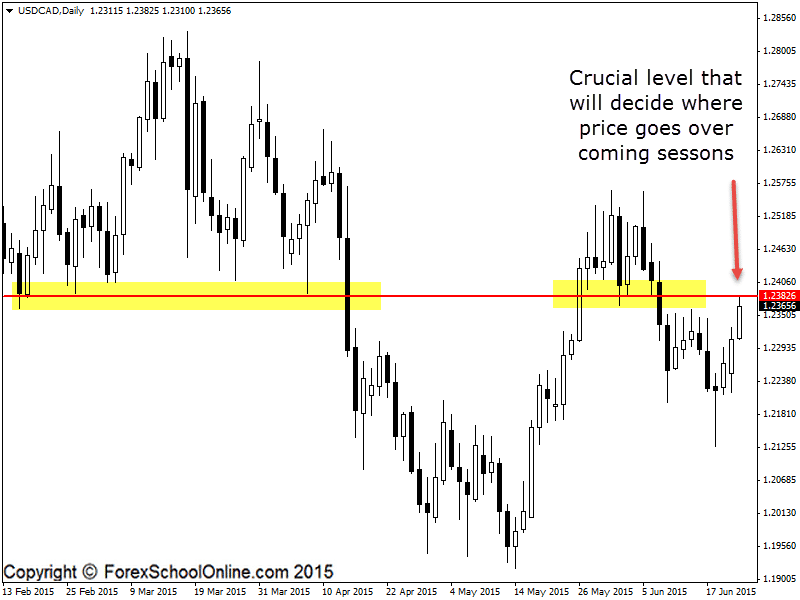
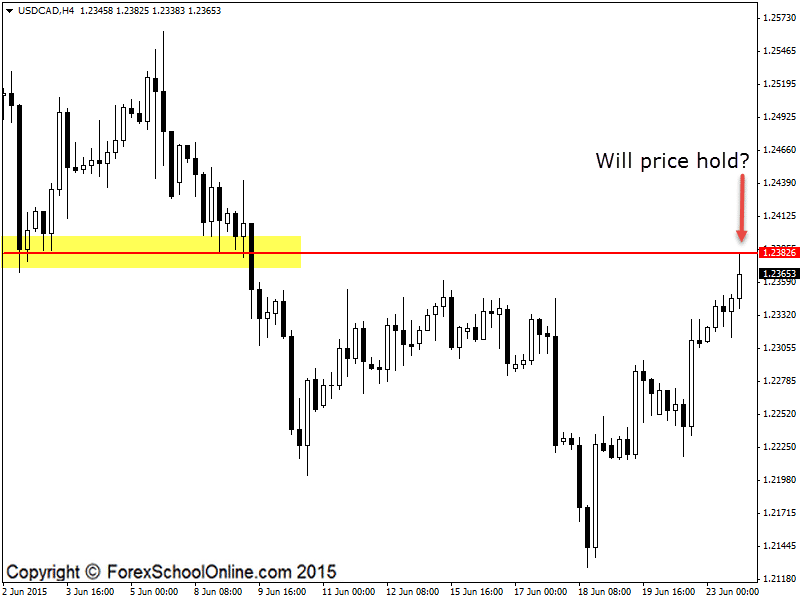
There is a lot happening in the Forex markets tonight as I write this up for you. The two Forex pairs I am concentrating on in the daily trade setups commentary are the GBPCHF and USDCAD, but there are a lot of other pairs, major stock indices and other markets either breaking out or moving into major areas.
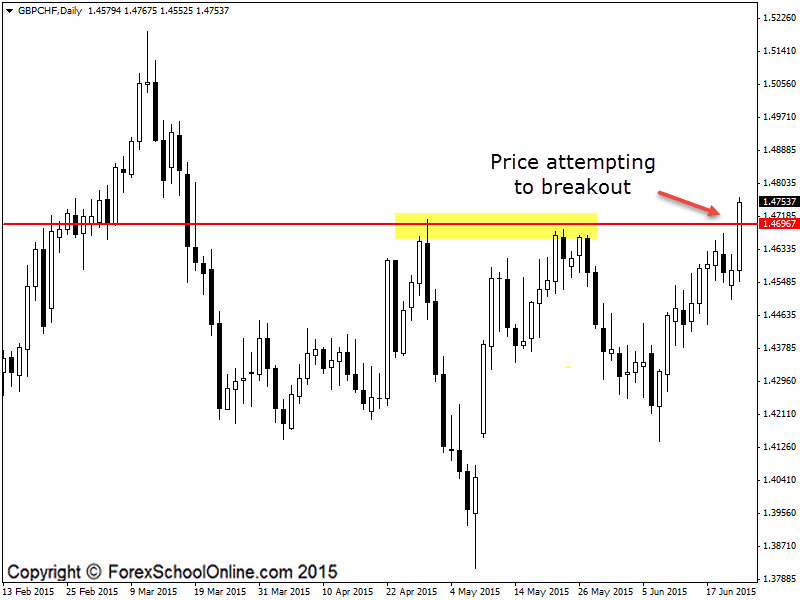
As the daily price action chart of the GBPCHF chart shows below; price is ‘attempting’ to breakout higher of the major daily resistance.
I put the word attempting in brackets because as yet price has not yet moved higher and closed above the daily resistance and until we can see price close strongly above the daily level, we cannot be sure that the level has been broken.
I talk about this and just how important where price can and cannot close is in the USDSGD Fires Off Huge Engulfing Bar to Break Price Flip Support | 19th June 2015 post.
Now that price is attempting to break higher it is the job of the price action trader (You) to start reading the price action and the whole price action story. This is where the pattern trader who only knows how to find and trade the last one or two candles on the chart comes unstuck, whereas the price action trader can come into their own.
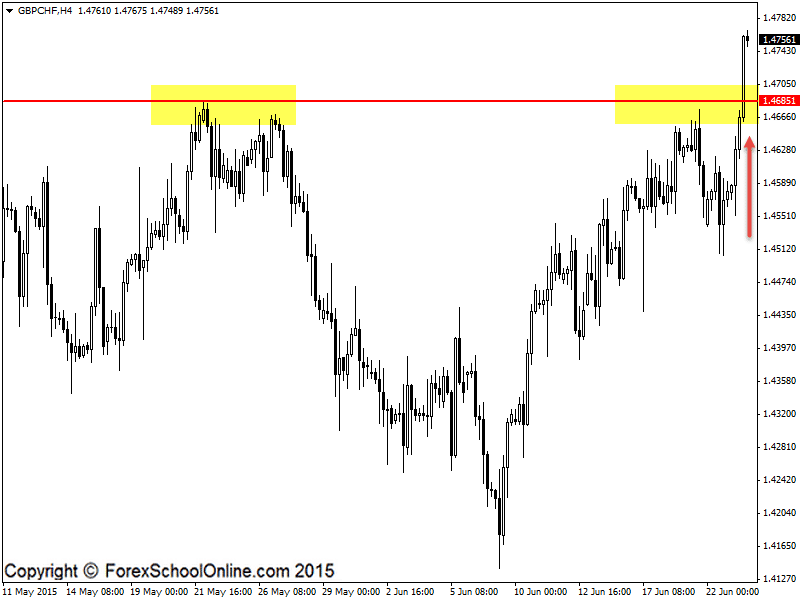
The price action trader can move to the smaller intraday time frames such as the 4 hour chart or smaller and look to either take a long trade at the major daily breakout area if price action confirms and gives off a trigger signal showing price is going to hold at the old resistance/new support, or wait and look to see if the breakout was actually a ‘fakeout’ because price could not close above with any conviction.
I highly recommend you read the trading lesson where you can learn to take super high probability trades here;
First Test Support/Resistance Price Action Trading Strategy
GBPCHF Daily Chart

GBPCHF 4 Hour Chart

USDCAD Daily Chart

USDCAD 4 Hour Chart


Leave a Reply