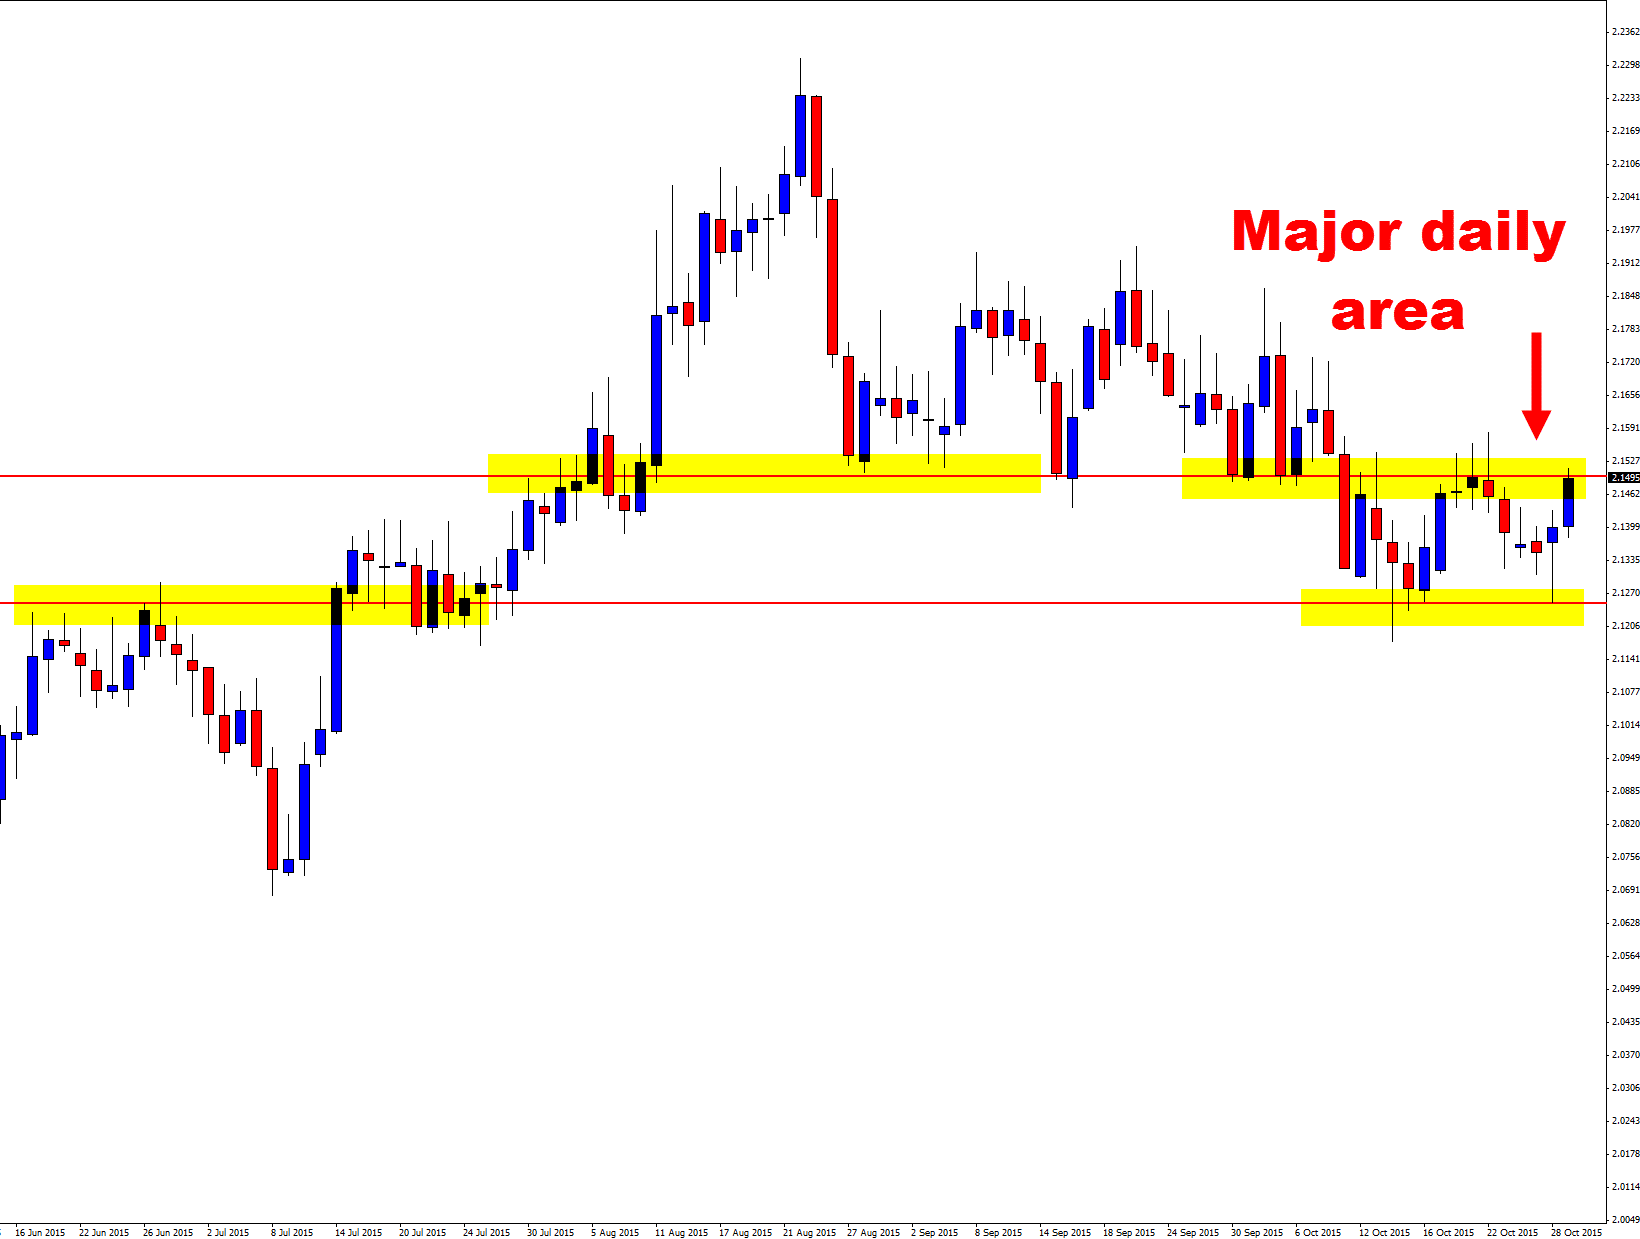
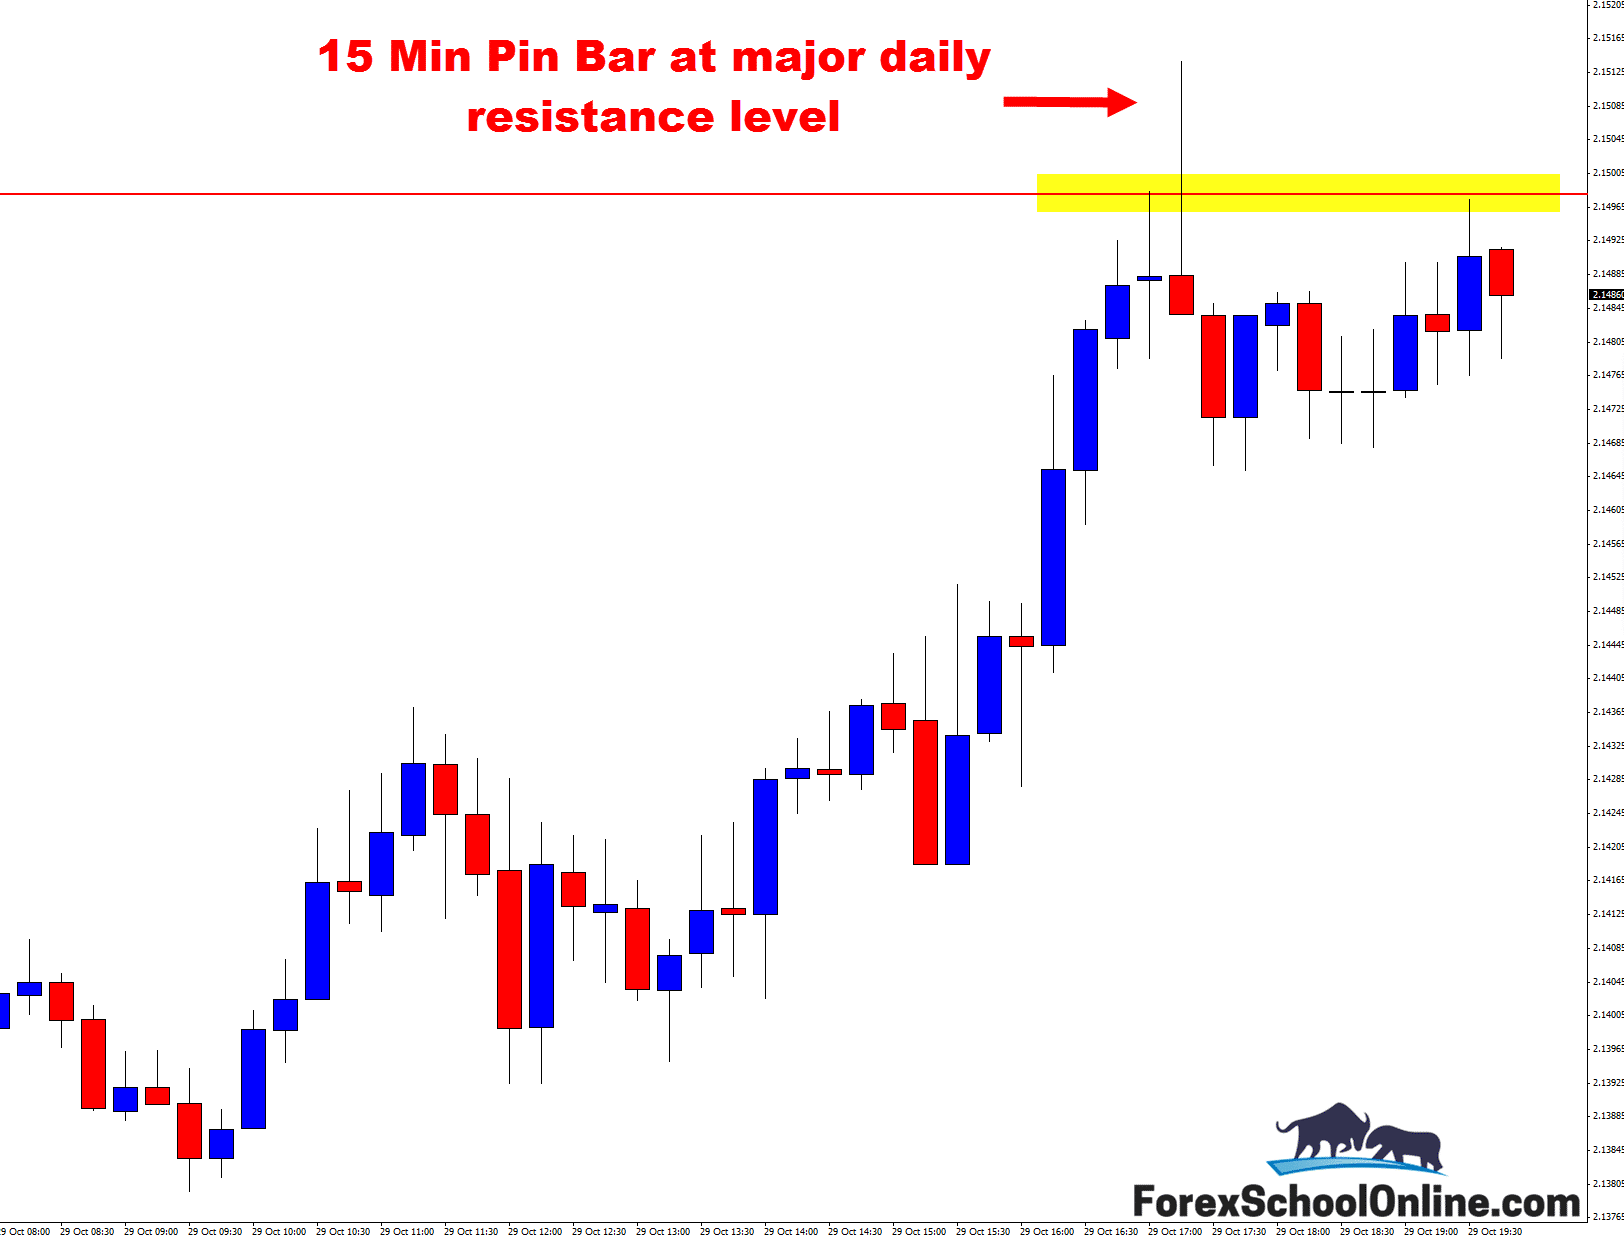
Price on the 15 minute chart of the GBPCHF has fired off a pin bar reversal rejecting a major daily resistance level. This pin bar is up at a major swing high, but it is also against a lot of strong momentum on the intraday chart.
To make a high probability trade, we need to place together the WHOLE price action story and not just a pattern. In other words, we are not just looking for a pin bar by itself or even just a pin bar at a major level – we are looking for a really compelling price action story, AND then, we are looking for the price action trigger signal, such as the pin bar reversal.
This is how we are able to trade trigger signals on all sorts of time frames, as long as we adhere to some key fundamental rules. We can move down to time frames, such as the 15 minute chart and make trigger signals if we know these rules and always obey them. We can’t; however, just all of a sudden turn up and start trading the 15 minute chart out of no where. We need to earn our way down there like I discuss in the lesson Daily Chart Strategies Down to the Intraday Timeframes.
The best setups are found trading with the trends and with the momentum. This is part of putting another factor in our favor with the compelling price action story. If we can look to trade with a really strong trend and at a major level, then we can start to hunt some really high probability trade setups.
As the daily chart shows here, this is a major level on the daily chart. The 15 minute chart is firing off a really solid pin bar, but it is against the strong momentum on the 15 minute chart. As I show you in the How to Trend Trade Price Action Lesson, it is important we trade each chart individually and trade each trend as it’s own.
For example, we do not want to look to the weekly chart and trade that trend on the 15 minute chart or even the 4 hour chart. Each chart is separate and there is a very good reason for why I go through them in that lesson.
If price can continue the move lower from the 15 minute pin, then the next support of interest comes in around the 2.1450 area. As I write this; however, price is attempting to break and close above the daily resistance level. If this happens, we can look for this level to act as a price flip and for price to flip from an old resistance to a new support.
Daily Chart – major daily level
15 Minute Chart – pin bar reversal


Leave a Reply