Hi guys,
just a quick heads up; as you have probably noticed by now, I am testing making these daily trade setup posts at a few different times of the day lately to see what brings you the most value, what helps your trading the most and what you get the most out of.
For a long time I made the posts straight after the New York close daily candle closed and I can go right back to that if it turns out that, that is what helps you the most, but I want to find out if there is another time that would potentially help you more. I would love to hear your thoughts on this and if you think it matters, so please post what you think in the comments section below.
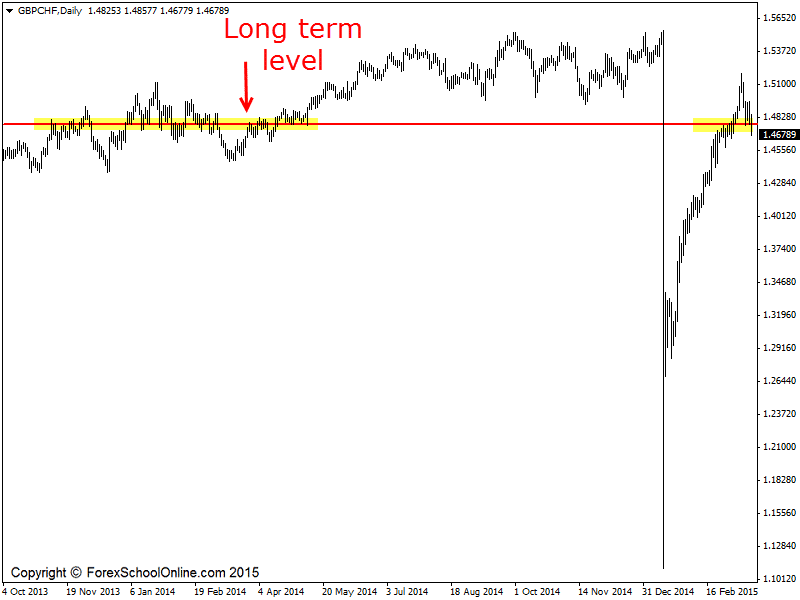
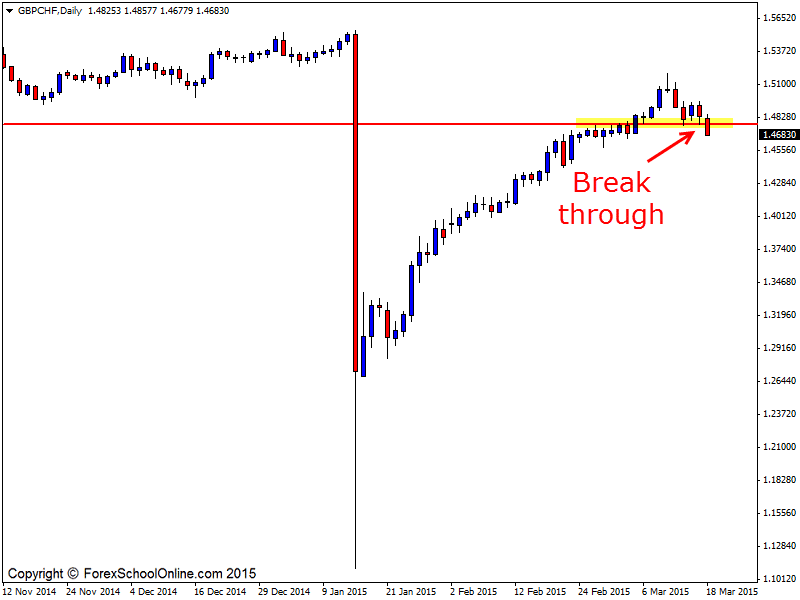
Price now during the US session has gained some real pace and momentum and has broken out of a long term daily support level on the GBPCHF chart. As the zoomed out chart shows below of the GBPCHF; this level has been a key level now for an extended period of time.
A question I often get asked is “How long do we need to look back on the charts for our support & resistance?” and the thing is that the major support and resistance levels will just continue to flip over and over again. Most of these major levels you can go right back and follow way back through your charts.
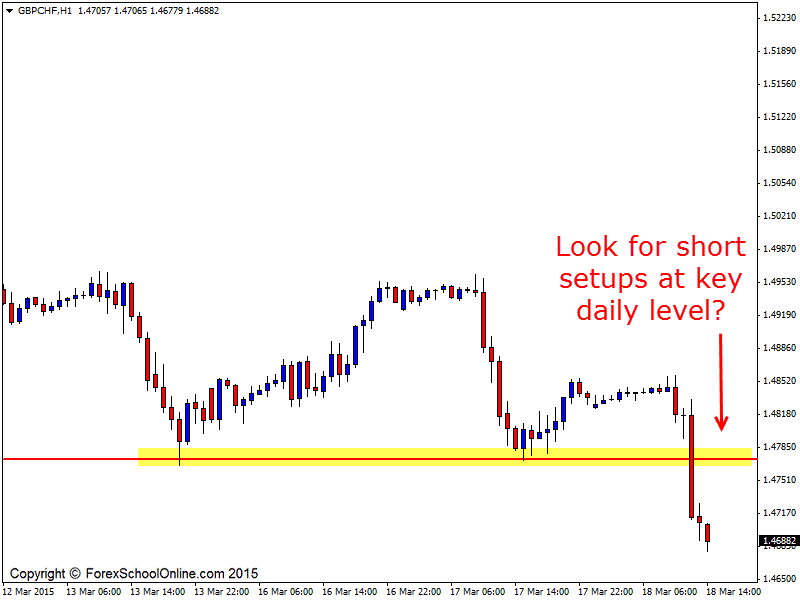
Now that price has broken through the key daily level it could present with an opportunity for traders to look for short trades on their intraday charts such as the 4 hour, 1 hour or even lower time frame charts should price make a quick re-test of the old breakout level.
As so often happens and as we have shown regularly in this blog; price will make a quick break through a major level like this and then traders can look to enter at the same price flip level when it turns from an old support into a new resistance.
The key to a quality trade is reading the price action behavior and looking for a high probability price action trigger signal such as the ones taught in the Forex School Online Course if price does retrace back higher into the new resistance level.
Daily Chart – Zoomed Out

Daily Chart – Zoomed in

1 Hour Chart


Leave a Reply