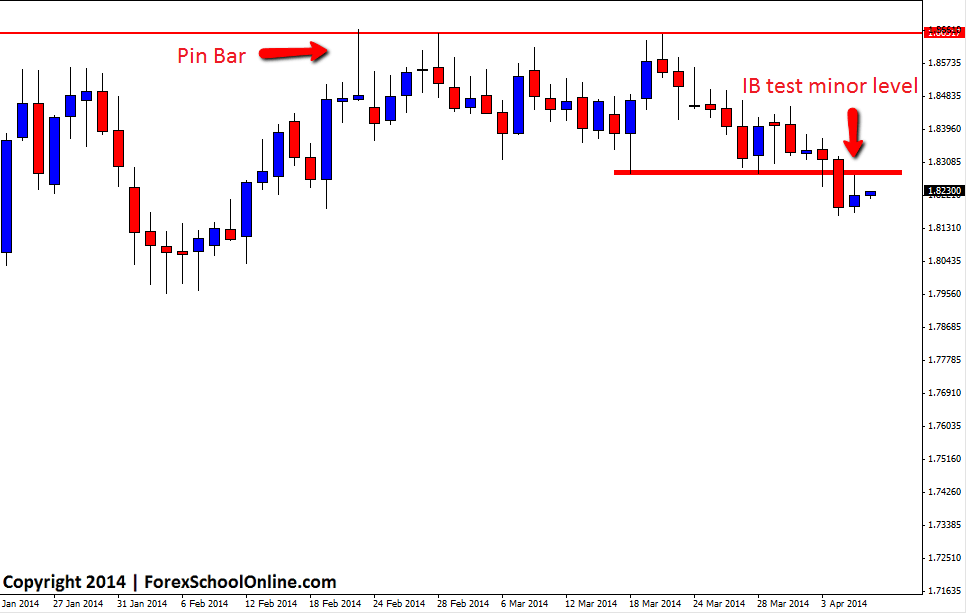
The GBPCAD has formed an inside bar (IB) on the daily price action chart. Price has recently just made a strong run lower after price had been in a roaring trend higher for months on end. After being in this roaring trend higher, price hit resistance where it formed a Pin Bar on the daily chart and started to top. This pin bar did not work out straight away, but instead sent price into consolidation and over the next 30 days price traded sideways and went into a fight where the bulls and the bears scrapped to see who could control price.
Price has now made a push lower to where it has formed an inside bar. Whilst inside bars are not great reversal signals, they can be useful clues for price action traders. This inside bar; as the chart shows below, moved higher during the daily session to test the minor resistance where it was met by the bears and pushed lower. This is crucial because at this stage the new found lower momentum is still holding and is continuing shown by the inside bars rejection.
If price breaks the the housing bar (the candle that is housing the inside bar) lows we may see a continuation of this new lower momentum and a quick move lower into the near term support level. A break lower of the housing bar needs to occur for confirmation for the lower momentum to continue, otherwise a continuing of the sideways chop that has been occurring could be likely.
GBPCAD Daily Chart


Leave a Reply