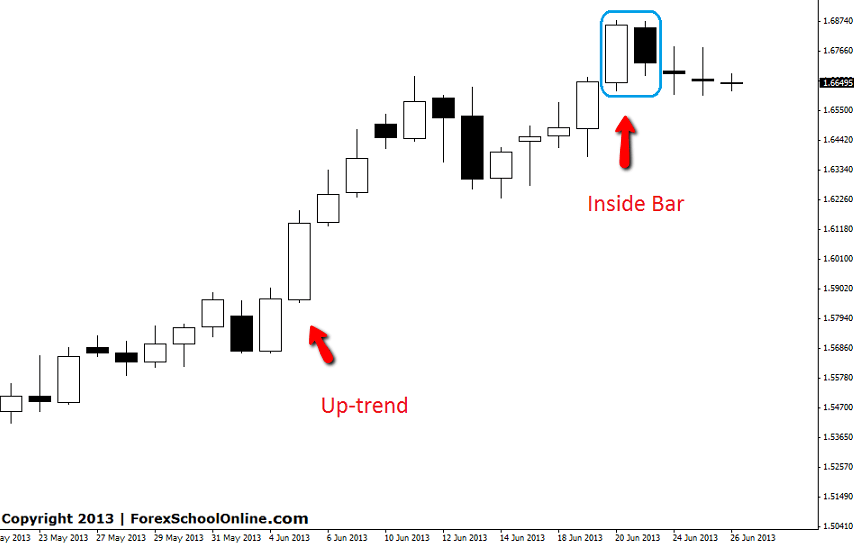
The GBPAUD is winding up on the daily chart and has produced an inside bar. Price has been in an extended up-trend with price making higher highs and higher lows. Price hit a top and formed the first inside bar. After pulling back slightly price has paused and is now winding up like a spring.
Price is tightly winding up and the longer the winding up goes on, normally the more powerful the break out is. Breakouts more often than not will break out in the same direction that price was trending before price went into the tight wind up. In this case price was trending up so the probabilities are that price will break out higher.
Traders should now be on the look out for break out plays on all time frames including the daily charts on this pair. If price can break out lower it will have to break a key support level. If price can break out higher it will have to break the recent top area, but once that is cleared there is an absolute paddock of space for price to race into which has the potential for a large risk reward trade.
GBPAUD DAILY CHART | 26 JUNE 2013


Leave a Reply