British Pound Price Prediction – July 6
There has been a long-featuring of the GBP/USD’s price trades within bearish channels. The currency pair records a valuation of around 1.3848 at a percentage rate of about 0.09 as of writing.
GBP/USD Market
Key Levels:
Resistance levels: 1.3900, 1.4000, 1.4100
Support levels: 1.3700, 1.3600, 1.3500
GBP/USD – Daily Chart
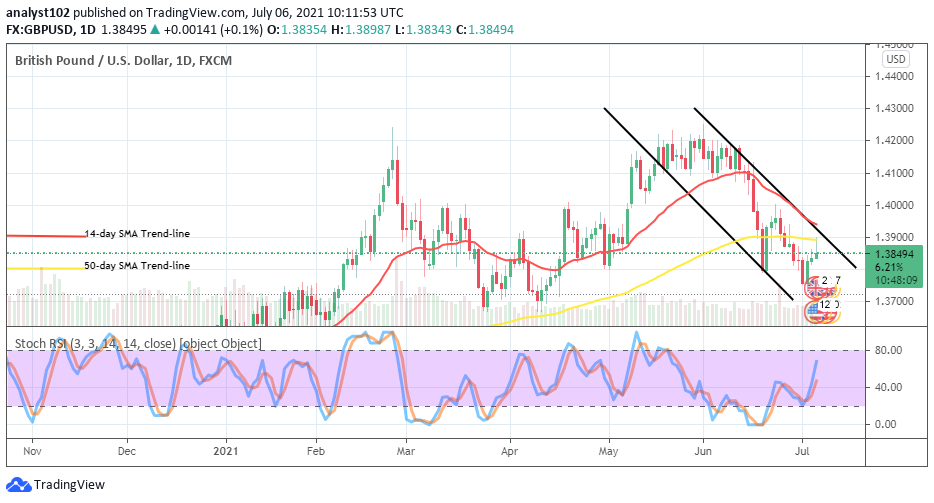
On the GBP/USD daily chart, the currency pair trades within bearish channels after hitting resistance at 1.3900 at the early hour session of today. The 14-day SMA trend-line drew southward closely alongside the upper bearish trend-line channel as the 50-day SMA indicator is close underneath it at the level earlier mentioned. The Stochastic Oscillators have swerved the lines northbound from the range of 20 slightly, pointing toward the north. That indicates that the base currency may again push for resistance at a later time. As for GBP/USD trades within bearish channels, will it keep it furthermore?
From most of the indicators’ readings, the market valuation of GBP/USD trades within bearish channels will most likely keep it furthermore until some subsequent trading sessions. A notable pull-down motion of this currency pair coupled with reversal may consider bulls to come back. Traders that believe, going long in this, needed to exercise some degree of cautiousness.
On the downside, the level at 1.3900 will play a crucial role in deciding the reliable entry of a downward order of the currency market. The GBP/USD market bears may have to be on the lookout for a decent sell position around the upper bearish channel trend-line.
In summary, the selling force seems to have dominated the current trading psyche of GBP/USD. As a result, traders may have to be on the lookout for price rejection movement around the upper path of the bearish channel trend-line before considering a sell order that has the backing of price action to the downside. GBP/USD 4-hour Chart
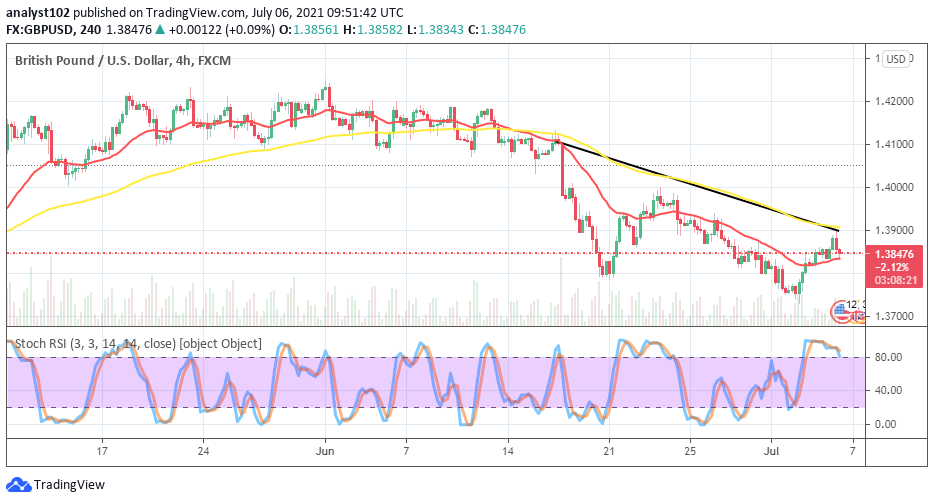
On the GBP/USD medium-term chart, there has been a line of notable pull-ups against the smaller SMA, closely approaching the bigger SMA to the north side. However, the trend outlook is still seen, maintaining a bearish formation. The 50-day SMA indicator is at the level of 1.3900 over the 14-day SMA trend-line. And, the bearish trend-line drew downward to back up the resistant posture that the bigger SMA keeps. The Stochastic Oscillators with conjoined lines in the overbought region, moving in a consolidation manner in it. That suggests that a downward force will regain control of the currency pair in the near time.
Note: Forexschoolonline.com is not a financial advisor. Do your research before investing your funds in any financial asset or presented product or event. We are not responsible for your investing results.
Learn to Trade Forex Online
GBP/USD Trades Within Bearish Channels
Footer

ForexSchoolOnline.com helps individual traders learn how to trade the Forex market
WARNING: The content on this site should not be considered investment advice and we are not authorised to provide investment advice. Nothing on this website is an endorsement or recommendation of a particular trading strategy or investment decision. The information on this website is general in nature so you must consider the information in light of your objectives, financial situation and needs.
Investing is speculative. When investing your capital is at risk. This site is not intended for use in jurisdictions in which the trading or investments described are prohibited and should only be used by such persons and in such ways as are legally permitted. Your investment may not qualify for investor protection in your country or state of residence, so please conduct your own due diligence or obtain advice where necessary. This website is free for you to use but we may receive a commission from the companies we feature on this site.
We Introduce people to the world of currency trading. and provide educational content to help them learn how to become profitable traders. we're also a community of traders that support each other on our daily trading journey
Forexschoolonline.com is not a financial advisor. Do your research before investing your funds in any financial asset or presented product or event. We are not responsible for your investing results.

Leave a Reply