GBP/USD Price Prediction – November 29
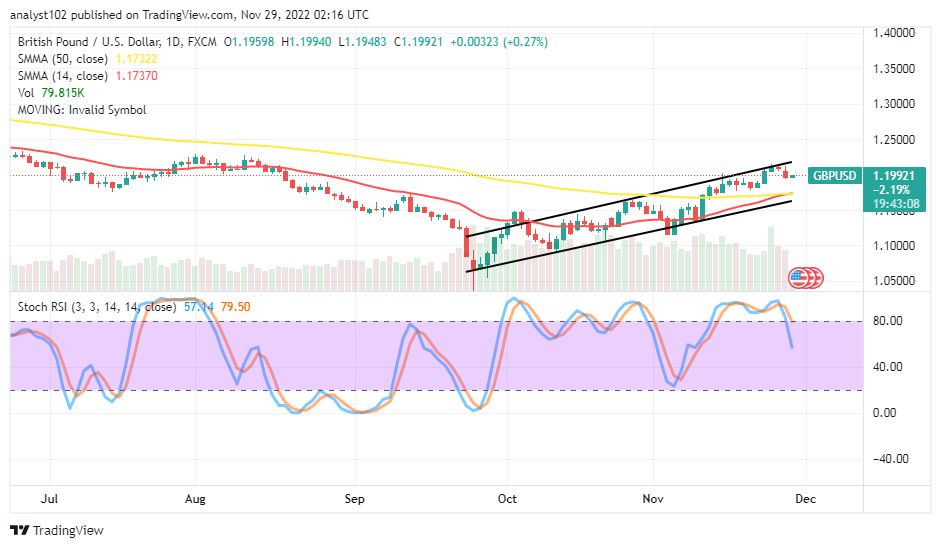
In the recent trading exercises of the GBP/USD market after making a short line of substantial ups, the currency pair has now resumed a bearish operation around the 1.2100 spots. As of this writing, the price is near the 1.19921 line at an average positive percentage rate of 0.27 per minute.
GBP/USD Market
Key Levels:
Resistance levels: 1.2100, 1.2200, 1.2300
Support levels: 1.1700, 1.1600, 1.1500
GBP/USD – Daily Chart
The GBP/USD daily chart showcases the currency pair market resuming a bearish operation after encountering resistance around the 1.2100 resistance level. The bullish channels have been drawn slightly across the SMA trend lines to embody the 14-day SMA indicator at 1.17370, which is briefly above the 1.17322 value point of the 50-day SMA indicator. The Stochastic Oscillators have crossed southbound from the overbought region to 79.50 and 57.14 levels.
Will the bullish momentum on the GBP/USD market soon surpass the 1.2100 resistance?
Going by the reading capacity possibility length the GBP/USD market has pushed at the moment appears the currency pair trade has to some extent, resumed a bearish operation around the 1.2100 resistance line. Therefore, buyers are to suspend their making comeback efforts for a while.
On the downside of the technical analysis, long-position placers seem to have had the advantage over time, having been able to force the move to a high point of the 1.2100 resistance spot. As long as the price stays below the value line for future sustained gains, sellers may resume their shorting campaigns soon.
In the summary analytics, bulls in the GBP/USD market operations may have to be patient until the price touch a point for building support around the SMA values. However, traders who have opened short positions may ride the present trends to the downside, settling a stop loss order at or near 1.2150, depending on the trader’s risk tolerance.
GBP/USD 4-hour Chart
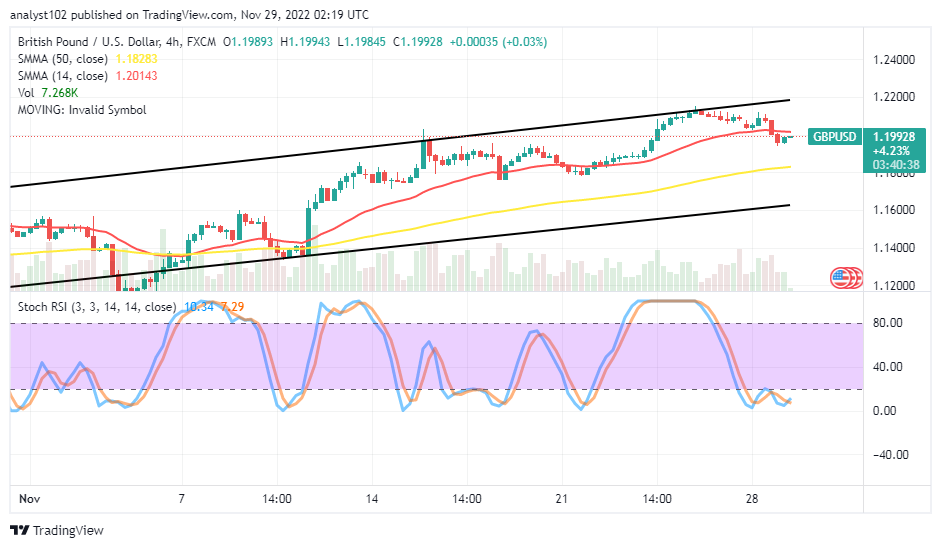
The GBP/USD medium-term chart shows the currency pair trade has been in a bullish outlook for some time. The 14-day SMA indicator is at 1.20143 over the 1.18283 value line of the 50-day SMA indicator. And they are pointing toward the north in the bullish channel trend lines drawn. The Stochastic Oscillators red line is at 7.29 level, and the blue line is attempting to cross it back northbound at 10.34 level to signify that buying pressure has the chance of holding for a while against near possible drawdowns.
Note: Forexschoolonline.com is not a financial advisor. Do your research before investing your funds in any financial asset or presented product or event. We are not responsible for your investing results.
Learn to Trade Forex Online
GBP/USD Trade Resumes a Bearish Operation at 1.2100
Footer

ForexSchoolOnline.com helps individual traders learn how to trade the Forex market
WARNING: The content on this site should not be considered investment advice and we are not authorised to provide investment advice. Nothing on this website is an endorsement or recommendation of a particular trading strategy or investment decision. The information on this website is general in nature so you must consider the information in light of your objectives, financial situation and needs.
Investing is speculative. When investing your capital is at risk. This site is not intended for use in jurisdictions in which the trading or investments described are prohibited and should only be used by such persons and in such ways as are legally permitted. Your investment may not qualify for investor protection in your country or state of residence, so please conduct your own due diligence or obtain advice where necessary. This website is free for you to use but we may receive a commission from the companies we feature on this site.
We Introduce people to the world of currency trading. and provide educational content to help them learn how to become profitable traders. we're also a community of traders that support each other on our daily trading journey
Forexschoolonline.com is not a financial advisor. Do your research before investing your funds in any financial asset or presented product or event. We are not responsible for your investing results.

Leave a Reply