GBP/USD Price Prediction – August 22
The present situation has it that the GBP/USD trade is under selling pressure as the currency pair price bargains around 1.1770. It is noticed that the market average negative percentage rate is at 0.45.
GBP/USD Market
Key Levels:
Resistance levels: 1.1900, 1.2000, 1.2100
Support levels: 1.1700, 1.1600, 1.1500
GBP/USD – Daily Chart
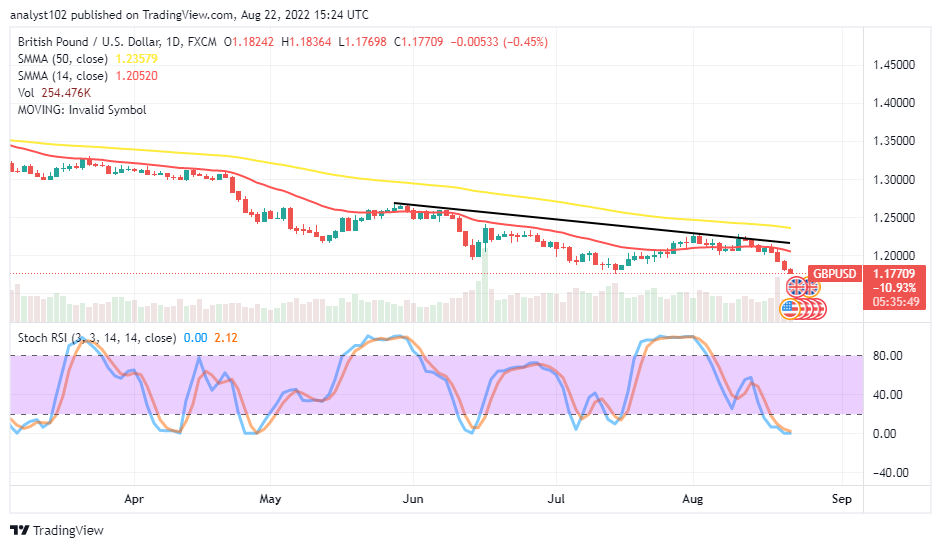
The daily chart reveals the GBP/USD market operation is under selling pressure below the sell signal sides of the SMAs. The bearish trend line drew to markdown the psychological points that the trade keeps to the downside. The 14-day SMA indicator is at 1.20520 underneath the 1.23579 value point of the 50-day SMA indicator. The Stochastic Oscillators have extended their southbound motions into the oversold region as they keep 0.00 and 2.12 range values within. Should sellers continue with the exertion of new orders at this point in the GBP/USD market?
It is apparent that there has been an oversold reading condition in the GBP/USD market operation; sellers may have to be wary of exerting new shorting orders even though the currency pair trades are under selling pressure. Buyers need to wait for a re-emergence of a bullish candlestick to confirm a probable resumption buying cycle at a lower-trading end afterward.
On the downside of the technical, the GBP/USD market bears, at this point, have to consolidate their stances beneath the 1.1800 level. If a rebound eventually occurs between the 1.1770 and the value line earlier mentioned, short-position takers may be on the verge of losing positions in no time.
In summary, traders, especially the GBP/USD market buyers need to allow the market to run into a formation to suit an outlook that will portend exhaustion of the downward motion before reconsidering a selling order afterward. GBP/USD 4-hour Chart
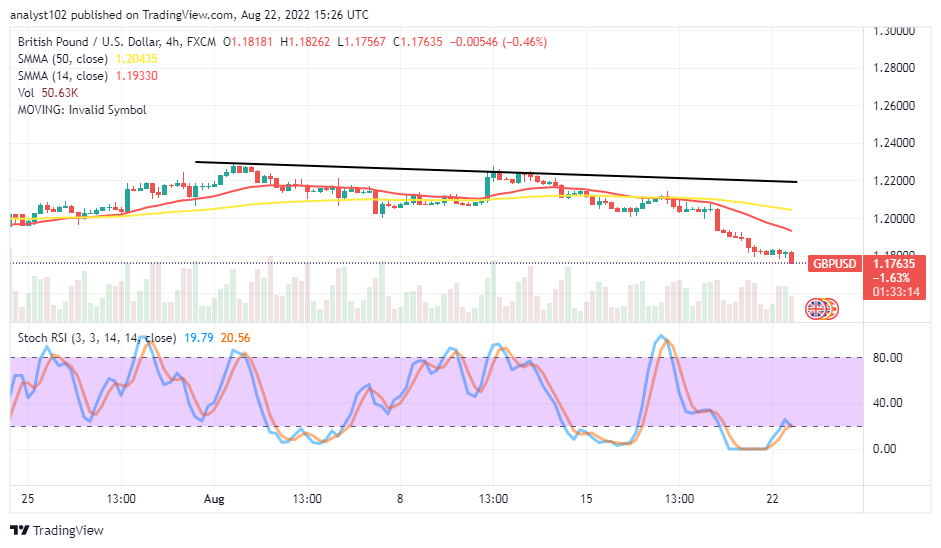
The GBP/USD medium-term chart reveals the currency pair market falls under selling pressure. The 14-day SMA indicator is at 1.19330 beneath the 1.20435 value line of the 50-day SMA indicator. The Stochastic Oscillators have dipped into the oversold region, keeping the range values of 20.56 and 19.79. And they are attempting to cross the lines southbound around the 20 range. That signifies that the trade still risks a drawdown in the following operation.
Note: Forexschoolonline.com is not a financial advisor. Do your research before investing your funds in any financial asset or presented product or event. We are not responsible for your investing results.
Learn to Trade Forex Online
GBP/USD Trade Is Under a Selling Pressure
Footer

ForexSchoolOnline.com helps individual traders learn how to trade the Forex market
WARNING: The content on this site should not be considered investment advice and we are not authorised to provide investment advice. Nothing on this website is an endorsement or recommendation of a particular trading strategy or investment decision. The information on this website is general in nature so you must consider the information in light of your objectives, financial situation and needs.
Investing is speculative. When investing your capital is at risk. This site is not intended for use in jurisdictions in which the trading or investments described are prohibited and should only be used by such persons and in such ways as are legally permitted. Your investment may not qualify for investor protection in your country or state of residence, so please conduct your own due diligence or obtain advice where necessary. This website is free for you to use but we may receive a commission from the companies we feature on this site.
We Introduce people to the world of currency trading. and provide educational content to help them learn how to become profitable traders. we're also a community of traders that support each other on our daily trading journey
Forexschoolonline.com is not a financial advisor. Do your research before investing your funds in any financial asset or presented product or event. We are not responsible for your investing results.

Leave a Reply