GBP/USD Price Prediction – February 22
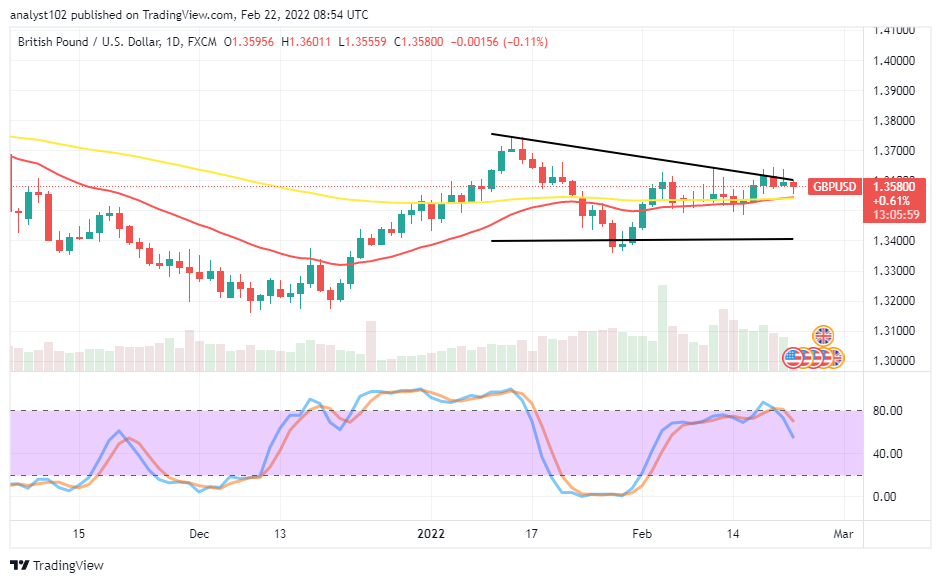
It has started to notice that the GBP/USD trade exhibits a rejection motion at 1.3600. And that could now comply to fall back into a downward trending outlook that the currency pair market has projected to follow. Price has witnessed a high value-line of 1.3601. But, it has lost about 21 pips as it trades around 1.3580 at a minute negative percentage of 0.11 as of writing.
GBP/USD Market
Key Levels:
Resistance levels: 1.3700, 1.3800, 1.3900
Support levels: 1.3500, 1.3400, 1.3300
GBP/USD – Daily Chart
The GBP/USD daily chart showcases the currency pair trade exhibits a rejection motion at 1.3600. With time, the rejection motion will get heightened. The bearish trend line remains drawn southward above the SMAs, joining the psychological lower path-points where resistances have taken place. The 14-day SMA indicator has moved up to conjoin with the 50-day SMA indicator at the sell signal side. The Stochastic Oscillators have crossed southbound from the range of 80, indicating a come-back for bearish trading condition prevalence afterward. Will the GBP/USD market buyers have an advantage over sellers as the currency pair trade exhibits a rejection motion at 1.3600?
Expectantly, fewer price actions can feature in the succeeding trading conditions of the GBP/USD price as the trade exhibits a rejection motion at 1.3600. The longing of orders around the point level may lead to the loss of upward momentums in no time. Based on that assumption, buyers could endeavor to suspend the placing of new orders at that trading capacity level.
On the downside of the technical trading analysis, the GBP/USD market short-position placers have to place much importance on getting entries around the 1.3600. If a push occurs over the value line, the situation can potentially reset to getting another round of sellings to dowse the bulls’ impacts that have featured so far.
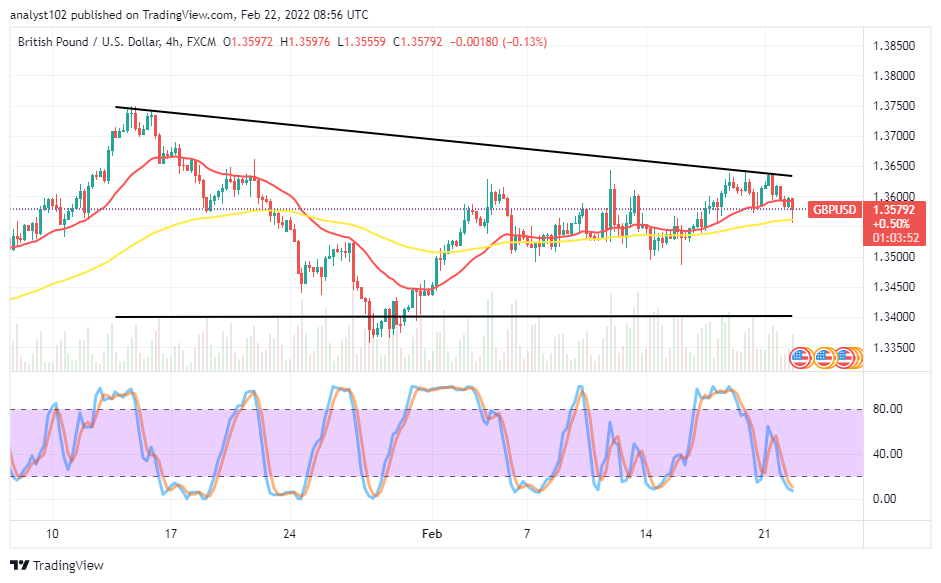
Summarily, the stage has begun getting set for the occurring of variant selling forces around 1.3600. Traders are to be on alert to spot while a powerful motion is made to the upside to create a reversal-moving signal before launching sell orders. GBP/USD 4-hour Chart
The GBP/USD medium-term chart showcases the currency pair trade exhibits a rejection motion around 1.3650, maintaining a bearish trend outlook. The 50-day SMA indicator is closely underneath the 14-day SMA indicator. The Stochastic Oscillators have moved down into the oversold region. It shows that pressures to the south side have been a bit exhausted. Short-position placers needed not to over-leverage positions. They may as well watch put for letting their entries be between 1.3600 and the value-line mentioned earlier.
Note:Forexschoolonline.com is not a financial advisor. Do your research before investing your funds in any financial asset or presented product or event. We are not responsible for your investing results.


Leave a Reply