GBP/USD Price Prediction – May 3
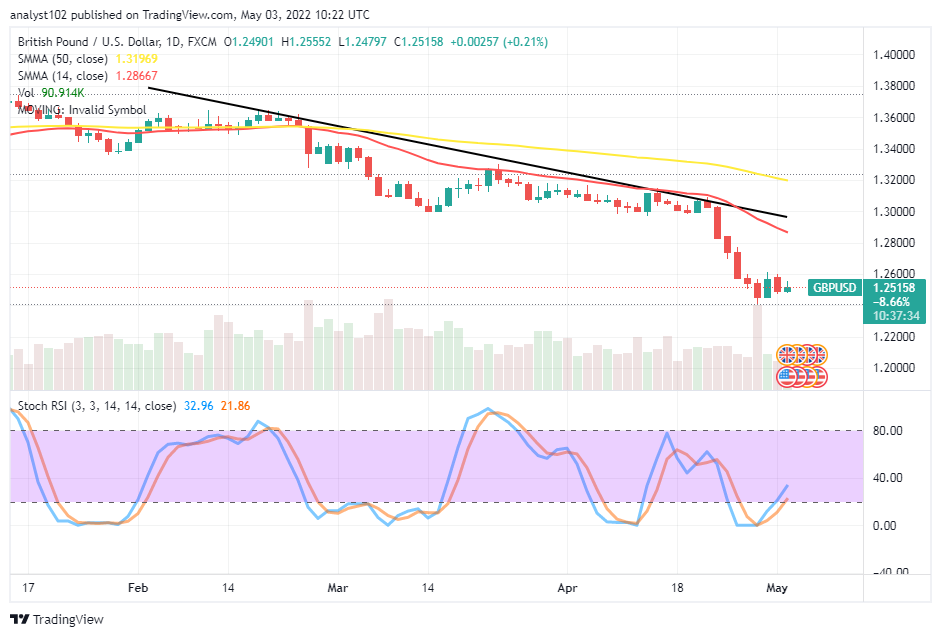
The last bearish motions in the GBP/USD market operations have not been totally over as the currency pair trade converges at a lower support zone near the 1.2400. The high and the low value-lines record a difference of about 76 pips as the market currently transacts around 1.2515, keeping a minimal percentage rate of +0.21.
GBP/USD Market
Key Levels:
Resistance levels: 1.2600, 1.2700, 1.2800
Support levels: 1.2400, 1.2300, 1.2200
GBP/USD – Daily Chart
The GBP/USD daily chart showcases the currency-pair trade converges at a lower support zone. The bearish trend line drew alongside the 14-day SMA trend line, marking the psychological points the downward process has taken up as the 50-day SMA trend line is above. The Stochastic Oscillators have crossed their lines slanting northbound from the oversold region against the 20 range closer to the 40 range line.  Will the GBP/USD price experience more slippages as the currency pair trade converge at a lower support zone?
An indication has been settling in to give a negative impression about getting more slippages in the GBP/USD market operations as the currency pair trade converges at a lower support zone. Based on that assumption, long-position players would now have to build up their stance on a support baseline around the 1.2400.
On the downside of the technical analysis, the GBP/USD market short-position takers should be wary of the 1.2600 resistance level. If a bullish candlestick emerges against it in the near time, it might not be easy to get back a correction against it in the near time. Therefore, it would be technically ideal to wait for another round of price rejection at a higher resistance spot to re-consider shorting back positions afterward.
Summarily, the GBP/USD market traders needed to focus on the area of convergences of 1.2600 and 1.2400 points. A breakdown of the lower value line may lead to more featuring of downs running into some days’ sessions. On the contrary, bulls are much-expected to take back the market’s control soon afterward. GBP/USD 4-hour Chart
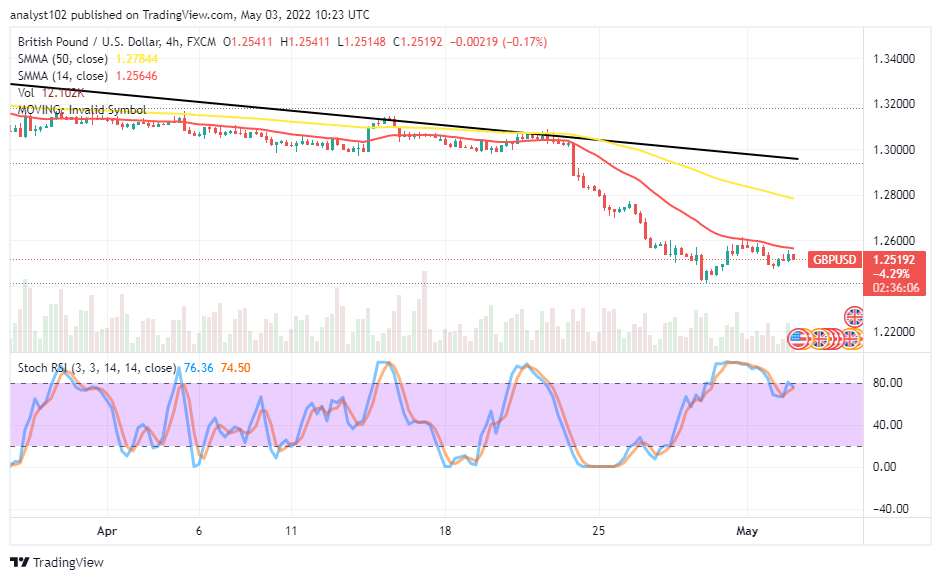
The GBP/USD medium-term chart exhibits the currency pair trade converges at a lower support zone. The 14-day SMA indicator is underneath the 50-day SMA indicator. A space separating the SMA trading tools shows that the price is under severe falling forces. The Stochastic Oscillators have moved southbound from the overbought region, seemingly trying to consolidate around the 80 range. Some falling can still feature in the market if the price cannot pull up forcefully against the 1.2600 resistance level.
Note: Forexschoolonline.com is not a financial advisor. Do your research before investing your funds in any financial asset or presented product or event. We are not responsible for your investing results.
Learn to Trade Forex Online
GBP/USD Trade Converges at a Lower Support Zone
Footer

ForexSchoolOnline.com helps individual traders learn how to trade the Forex market
WARNING: The content on this site should not be considered investment advice and we are not authorised to provide investment advice. Nothing on this website is an endorsement or recommendation of a particular trading strategy or investment decision. The information on this website is general in nature so you must consider the information in light of your objectives, financial situation and needs.
Investing is speculative. When investing your capital is at risk. This site is not intended for use in jurisdictions in which the trading or investments described are prohibited and should only be used by such persons and in such ways as are legally permitted. Your investment may not qualify for investor protection in your country or state of residence, so please conduct your own due diligence or obtain advice where necessary. This website is free for you to use but we may receive a commission from the companies we feature on this site.
We Introduce people to the world of currency trading. and provide educational content to help them learn how to become profitable traders. we're also a community of traders that support each other on our daily trading journey
Forexschoolonline.com is not a financial advisor. Do your research before investing your funds in any financial asset or presented product or event. We are not responsible for your investing results.

Leave a Reply