British Pound Price Prediction – September 14
It is now on the note that the GBP/USD trade averages a 1.3900 resistance level after a short line of retracements. The currency pair is trading around 1.3878, keeping the rate of percentage pace at a relative at around 0.29.
GBP/USD Market
Key Levels:
Resistance levels: 1.4000, 1.4100, 1.4200
Support levels: 1.3800, 1.3700, 1.3600
GBP/USD – Daily Chart
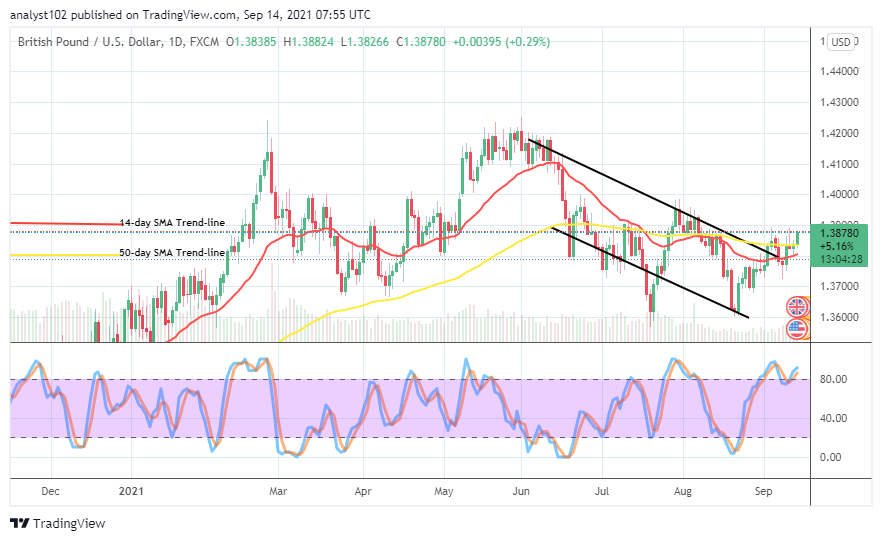
The GBP/USD daily chart reveals that currency pair trade averages a 1.3900 resistance level. In the last couple of days’ sessions, the market was trading around the trend line of the bigger SMA beneath the value line mentioned earlier. The 14-day SMA indicator is underneath the 50-day SMA indicator. The bearish channels left drawn as the upper trend line touches the 1.3800 support line, denoting it as a vital point. The Stochastic Oscillators are in the overbought region with the lines, making a northbound re-crossing effort at range 80. That suggests that some buying forces are ongoing. Would the current upward pressure suffice to push northward beyond the 1.3900 resistance level as trade averages it?
The expectation is rising as the currency pair trade averages1.3900 is now stronger than in past operations. It may take a few days more when there is an absence of active price action around the resistance trading line. In the light of that, long-position takers of this fiat currency pair would have to be on the lookout for price action moving in the upside direction to back up their entry procedures.
On the downside, historically, there had variant occasions that the GBP/USD price got a dump around the 1.3900 level. As the market now moving closer to the point again with the Stochastic Oscillators featuring in the overbought region calls for a possible loss of momentum to the downside if bulls tempt to relax in their pushing efforts. On that scenario playing out, the breaking down of the 1.3800 support level may potentially lead the market back down to revisit some of its previous lows.
In summary, the GBP/USD market operation may experience a pit stop between the levels of 1.3900 and 1.4000 even if it eventually breaches some resistances northward as it moves closer to the value line formerly mentioned. Price testing of a higher line back with a strong-resistant price action may cause the market some degrees of sell-offs once again. GBP/USD 4-hour Chart
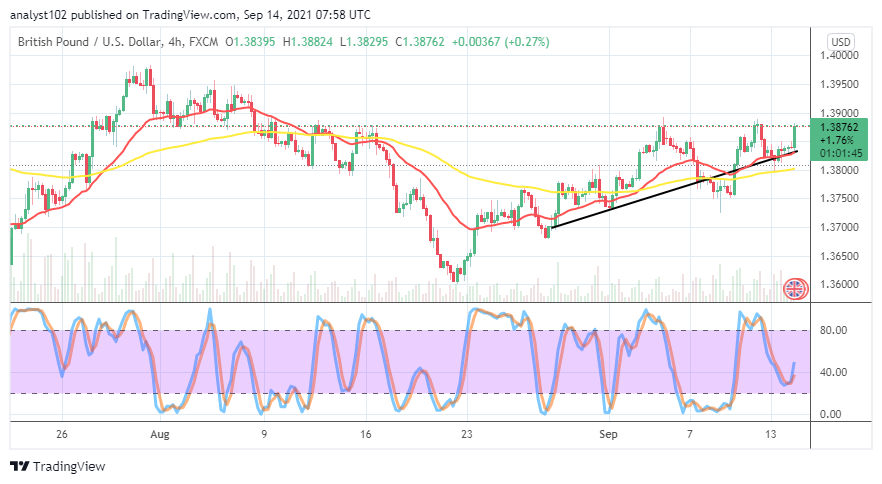
The GBP/USD medium-term chart shows that the currency pair trade averages 1.3900 resistance levels on a higher promising note. A bullish candlestick is in the making, signaling an active motion to the north side above the SMAs. The 14-day SMA indicator supported by the bullish trend line is above the 50-day SMA indicator. The Stochastic Oscillators have crossed the lines northbound within the ranges of 20 and 40. That indicates that bulls are, having control of the trade currently. A fearful reversion against 1.3850 may summarily spell an uglier situation to the uptrend motion continuation.
Note: Forexschoolonline.com is not a financial advisor. Do your research before investing your funds in any financial asset or presented product or event. We are not responsible for your investing results.
Learn to Trade Forex Online
GBP/USD Trade Averages 1.3900 Resistance Level
Footer

ForexSchoolOnline.com helps individual traders learn how to trade the Forex market
WARNING: The content on this site should not be considered investment advice and we are not authorised to provide investment advice. Nothing on this website is an endorsement or recommendation of a particular trading strategy or investment decision. The information on this website is general in nature so you must consider the information in light of your objectives, financial situation and needs.
Investing is speculative. When investing your capital is at risk. This site is not intended for use in jurisdictions in which the trading or investments described are prohibited and should only be used by such persons and in such ways as are legally permitted. Your investment may not qualify for investor protection in your country or state of residence, so please conduct your own due diligence or obtain advice where necessary. This website is free for you to use but we may receive a commission from the companies we feature on this site.
We Introduce people to the world of currency trading. and provide educational content to help them learn how to become profitable traders. we're also a community of traders that support each other on our daily trading journey
Forexschoolonline.com is not a financial advisor. Do your research before investing your funds in any financial asset or presented product or event. We are not responsible for your investing results.

Leave a Reply