GBP/USD Price Prediction – May 18
The trade operations between GBP and USD have seen the base currency pushing harder against its counter trading instrument as price now trades at the value of 1.4200 or thereabout. Currently, the market is valued at about a 0.55% increase during the time of writing.
GBP/USD Market
Key Levels:
Resistance levels: 1.4300, 1.4400, 1.4500
Support levels: 1.4000, 1.3900, 1.3800
GBP/USD – Daily Chart
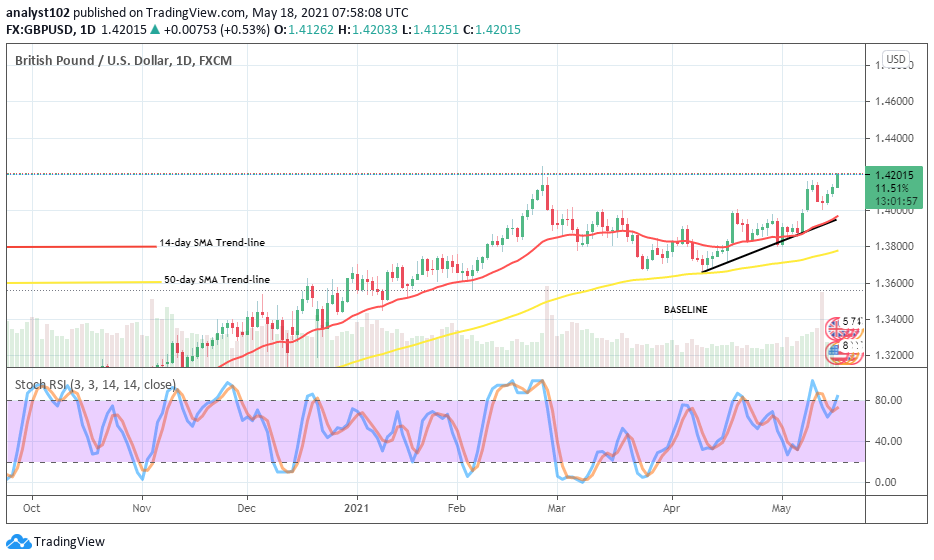
It is still shown on the GBP/USD daily chart that the currency pair is in a bullish outlook run. The market experienced a slight fall towards the level of 1.4000 on May 12. The subsequent trading days’ operations have been to the upside that has led price to trade now around the high level of 1.4200. The bullish trend-line and the 14-day SMA trend-line are closely drawn to point towards the north below the current market trading zone. The 50-day SMA indicator is located very near the point of 1.3800 from the below. The Stochastic Oscillators have in the first place moved out of the overbought region. But, they have now crossed the hairs back into it pointing towards the north direction. That indicates that some upward pressures will still play out in this currency trade. Will GBP/USD now survive trading past the point of 1.4200?
Around February 24, the currency pair saw a resistance that eventually gave birth to a downward correctional movement that later on allowed the GBP/USD bulls to rebuild their stance since April 12 at a lower point closer to the support level of 1.3600. Being as it is, price is again facing the same previous resistance level at 1.4200. Therefore, a total breakout of the point is highly needed to be able to nudge the currency pair trade into sustainable higher trading zones afterward.
As against the upside price movement, bears are to be on the lookout for a pit stop at a higher trading area that may eventually result in several price rejections. And, a sudden emergence of a long bearish candlestick afterward will potentially lead the market through a sizeable number of supporting levels especially, if the assumed downward pressure breaches the smaller SMA at the level of 1.4000 in the long run.
Summarily, going by technical trading approach, the current market resistance trading zone of 1.4200 appears very critical. And, as a result, it could in the long run be a decent sell entry point for bears. However, a forceful breakout of the zone may potentially allow the GBP/USD bulls a better edge to take the trade line to higher profiteering levels. GBP/USD 4-hour Chart
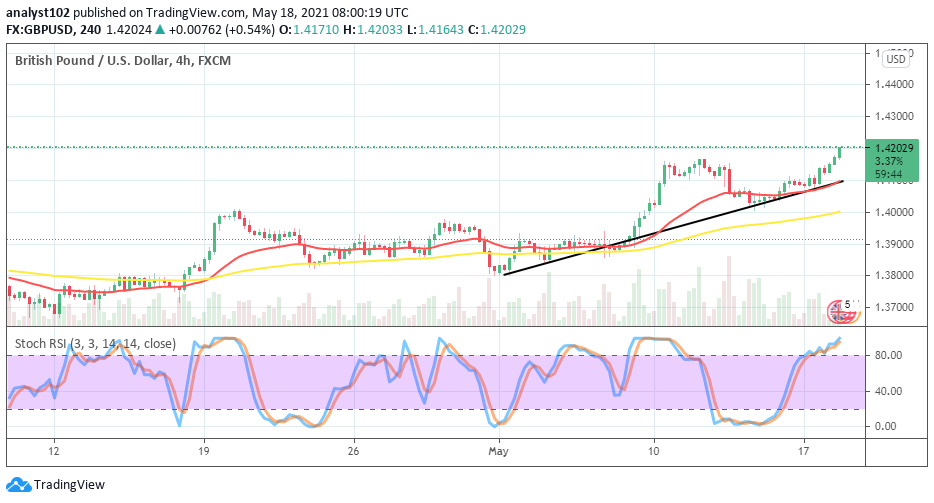
The 4-hour chart depicts that some bullish candlesticks are being formed to signal an extension in the current uptrend. A price correction occurred between May 10 and 14 leading the market to find support around the lowly placed position of smaller SMA. Both the bullish trend-line and the 14-day SMA are closely drawn to point towards the north below a high present trading area of the currency pair. The 50-day SMA indicator is located at the 1.4000 support line. The Stochastic Oscillators are in the overbought region with conjoined hairs pointing to the north. That suggests that some buying pressures still ongoing. An outright breakout of the 1.4200 level will possibly lead the market for a touch of a higher value at the 1.4300 line afterward.
Note: Forexschoolonline.com is not a financial advisor. Do your research before investing your funds in any financial asset or presented product or event. We are not responsible for your investing results.
Learn to Trade Forex Online
GBP/USD Struggles to Push Upside to the Point of 1.4200
Footer

ForexSchoolOnline.com helps individual traders learn how to trade the Forex market
WARNING: The content on this site should not be considered investment advice and we are not authorised to provide investment advice. Nothing on this website is an endorsement or recommendation of a particular trading strategy or investment decision. The information on this website is general in nature so you must consider the information in light of your objectives, financial situation and needs.
Investing is speculative. When investing your capital is at risk. This site is not intended for use in jurisdictions in which the trading or investments described are prohibited and should only be used by such persons and in such ways as are legally permitted. Your investment may not qualify for investor protection in your country or state of residence, so please conduct your own due diligence or obtain advice where necessary. This website is free for you to use but we may receive a commission from the companies we feature on this site.
We Introduce people to the world of currency trading. and provide educational content to help them learn how to become profitable traders. we're also a community of traders that support each other on our daily trading journey
Forexschoolonline.com is not a financial advisor. Do your research before investing your funds in any financial asset or presented product or event. We are not responsible for your investing results.

Leave a Reply