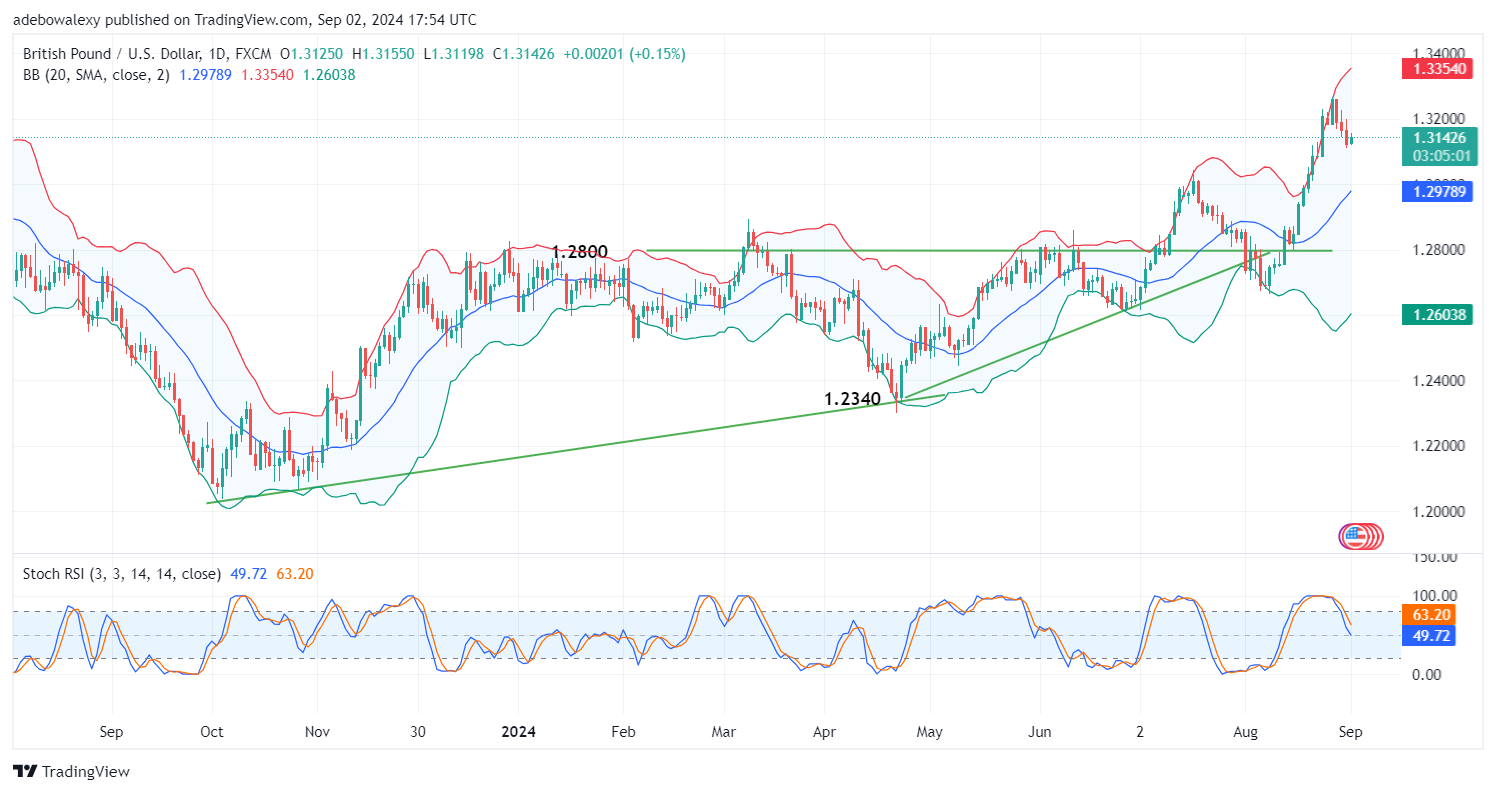
The GBP/USD market rebounded downward after price action climbed to a multi-month high the previous week. The rebound stems from the upbeat US economic data released during the first half of the week. However, the new week has started, and the US side of the market isn’t providing further stimuli due to the Labor Day break.
Key Price Levels:
Resistance Levels: 1.3200, 1.3300, 1.3400
Support Levels: 1.3100, 1.3000, 1.2900
GBP/USD Sees a Minor Retracement
While bears have more significant control over price movement in the GBP/USD market, upside forces have only printed a retracement in the opposite direction to the recently developed trend. The market developed this new trend when the USD regained momentum, coinciding with price action poking through the psychological resistance at the 1.3200 thresholds.
Nevertheless, the pair still trades above the middle limit of the Bollinger Bands (BB) indicator. Similarly, the BB indicator still has an upward trajectory. Also, the last price candle has printed a minor upward retracement, but the Stochastic Relative Strength Index (Stochastic RSI) lines are still trending downward.
GBP/USD Upside Momentum Thins
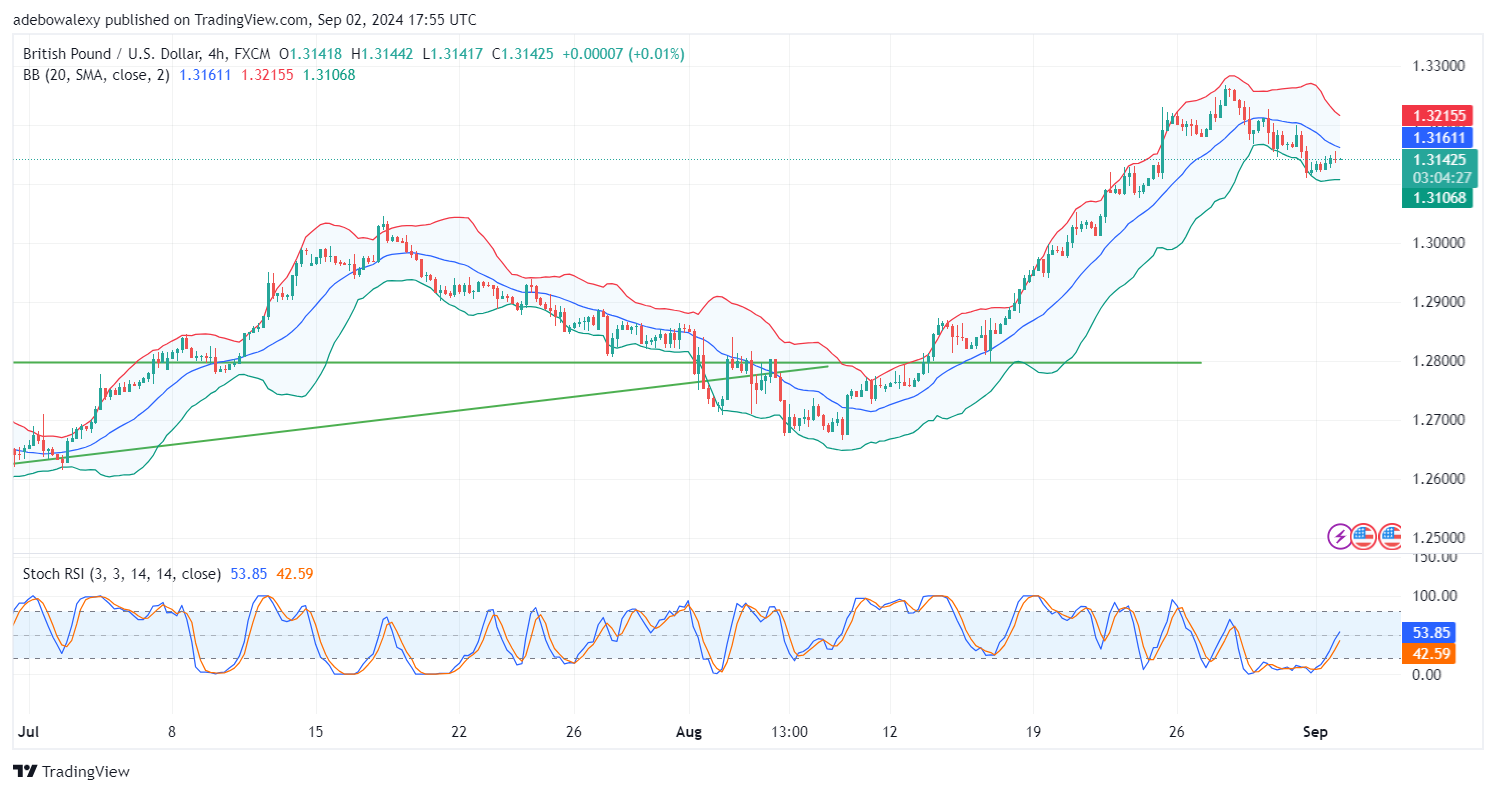
In the GBP/USD 4-hour market, it can be seen that price activity has fallen below the middle limit of the BB indicator. Additionally, price action has recently rebounded off the lowest band of the indicator. However, it can also be seen that price action has moved upward, and volatility seems to have steadily dwindled.
The last price candle here appears as a dashed green price candle, hinting that upside forces are weakening. The Stochastic RSI indicator lines haven’t risen far above the indicator’s 50 level. Technically, this still places the market well within the reach of downward forces. Therefore, traders might want to maintain their stance concerning price action reaching the 1.3100 price level.
Do you want to take your trading to the next level? Join the best platform for that here.


Leave a Reply