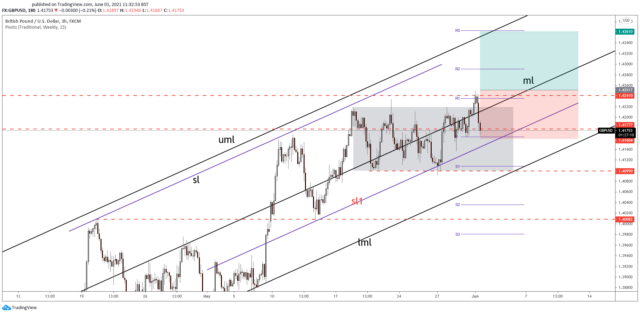
GBP/USD plunged today after reaching a new higher high or 1.4250 level. The rate dropped as the DXY rebounded. Unfortunately, the pair was rejected by a strong resistance area.
Now, GBP/USD has come back down to test and retest the support levels, downside obstacles. The price could start increasing again if the US Dollar Index resumes its decline after the US data.
The US ISM Manufacturing PMI could shake the markets later today. The economic indicator is expected to increase from 60.7 to 60.8. Worse than expected data could boost GBP/USD.
Technical Analysis!

GBP/USD found strong resistance at the 1.4241 level again, right above the weekly R1 (1.4235) level. Now is back within the short-term range pattern and under the ascending pitchfork’s median line (ml).
Despite the current decline, GBP/USD maintains a bullish bias as long as it stays above the weekly pivot point (1.4163) level. Also, the 1.4177 represents a downside obstacle. Technically, only a valid breakdown below the downside sliding line (sl1) could signal a potential bearish reversal.
GBP/USD could resume its upwards movement if it comes back above the median line (ml) and if it makes a valid breakout above the 1.4241 level.
Note: ForexSchoolOnline is not a financial advisor. Do your research before investing your funds in any financial asset or presented product or event. We are not responsible for your investing results.


Leave a Reply