GBP/USD Price Prediction – September 6
The market operation between Great Britain Pounce and the United States of America currency pair price tries, rebuilding on a support line after a long bearish motion. Buying and selling activities, as of the time of writing, take place between 1.1609 and 1.1514 value lines at an average percentage rate of 0.32.
GBP/USD Market
Key Levels:
Resistance levels: 1.1700, 1.1800, 1.1900
Support levels: 1.1400, 1.1300, 1.1200
GBP/USD – Daily Chart
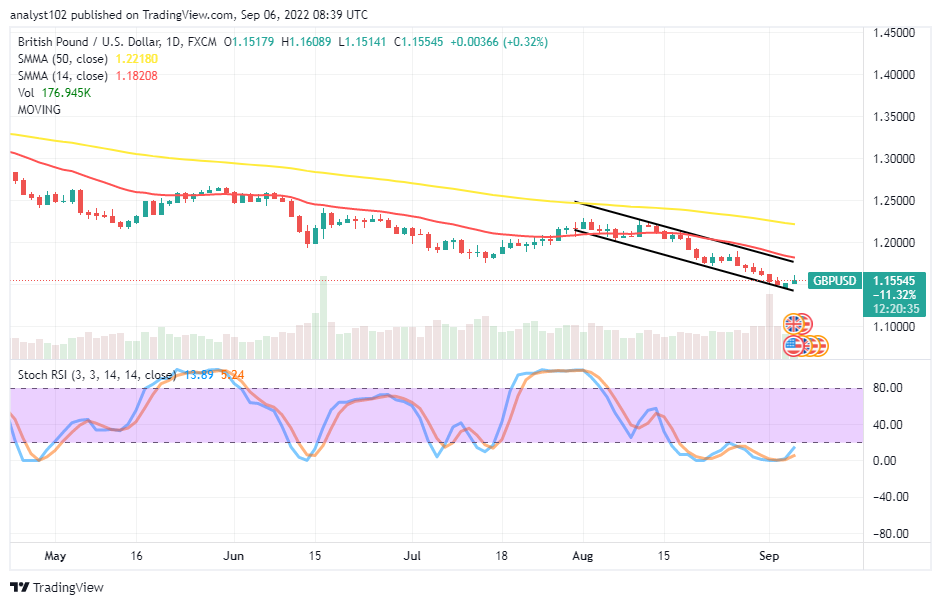
The daily chart reveals the currency pair price tries, rebuilding on a support line around the lower bearish channel trend line drawn to the south. The 14-day SMA indicator is at 1.1821 below the 1.2218 points of the 50-day SMA indicator. Yesterday’s session ended with a smaller bullish candlestick signifying the possible exhaustion of a series of downward-trending moves dominating the market over time. The Stochastic Oscillators are in the oversold region, maintaining 5.24 and 13.89 range values. Can there still be downs against the 1.1400 support in the GBP/USD market operation?
At the moment, any downs in an attempt to feature around may allow the GBP/USD market buyers to try rebuilding on a support line in the run. A downward consideration moving mode can negate an early resurfacing of variant upswings that have been expectantly to place. Buyers need not to overleverage positions at no time.
On the downside of the technical analytics, the GBP/USD market bears may need to allow the price to spring upward closely beneath the trend line of the 14-day SMA at 1.1821 for a retest before considering launching a sell order. Traders may go for the setting of a sell limit order around the value line.
In summary, bears in the GBP/USD market can only consolidate on the downward pressures leftover to continue to break through lower supports around the lower bearish trend line drawn. However, a set of bullish candlesticks is in the forming to indicate a dicey situation of getting reliable down. GBP/USD 4-hour Chart
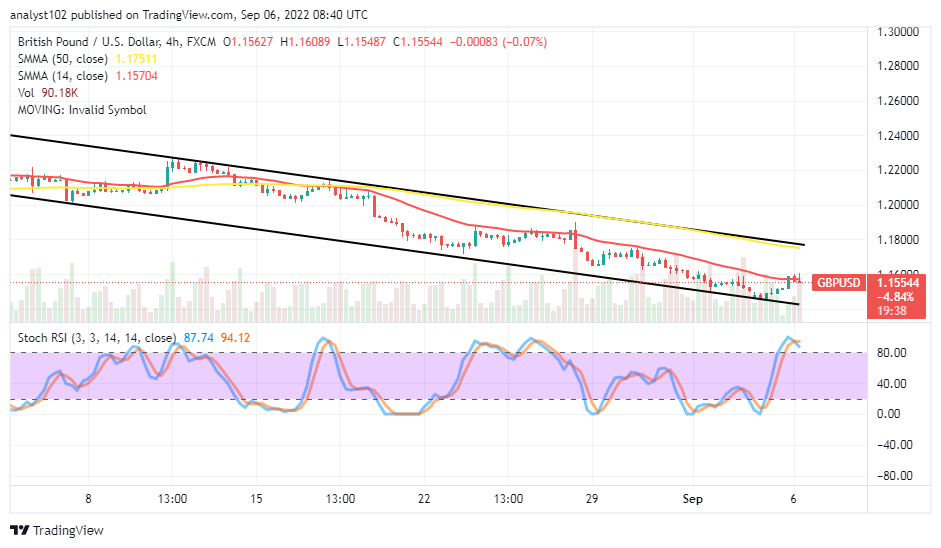
The GBP/USD medium-term chart showcases the currency pair price tries, rebuilding support around the lower bearish trend line. The 14-day SMA indicator is at 1.1570 below the 1.1751 points of the 50-day SMA indicator. The Stochastic Oscillators are in the overbought region, maintaining 87.74 and 94.12 ranges. It shows that price has encountered resistance around the 14-day SMA trend line. Therefore, a downward move is imminent.
Note: Forexschoolonline.com is not a financial advisor. Do your research before investing your funds in any financial asset or presented product or event. We are not responsible for your investing results.
Learn to Trade Forex Online
GBP/USD Price Tries, Rebuilding on a Support Line
Footer

ForexSchoolOnline.com helps individual traders learn how to trade the Forex market
WARNING: The content on this site should not be considered investment advice and we are not authorised to provide investment advice. Nothing on this website is an endorsement or recommendation of a particular trading strategy or investment decision. The information on this website is general in nature so you must consider the information in light of your objectives, financial situation and needs.
Investing is speculative. When investing your capital is at risk. This site is not intended for use in jurisdictions in which the trading or investments described are prohibited and should only be used by such persons and in such ways as are legally permitted. Your investment may not qualify for investor protection in your country or state of residence, so please conduct your own due diligence or obtain advice where necessary. This website is free for you to use but we may receive a commission from the companies we feature on this site.
We Introduce people to the world of currency trading. and provide educational content to help them learn how to become profitable traders. we're also a community of traders that support each other on our daily trading journey
Forexschoolonline.com is not a financial advisor. Do your research before investing your funds in any financial asset or presented product or event. We are not responsible for your investing results.

Leave a Reply