GBP/USD Price Prediction – September 20
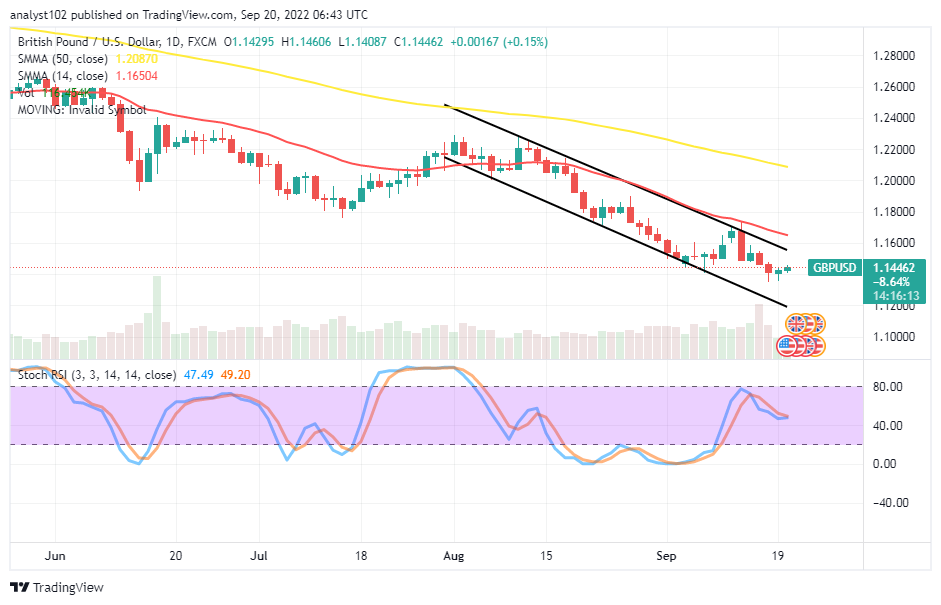
The overall trading outlook of the GBP/USD market portends the currency pair price trades in a bearish cycle over a long session. Today’s several hours have produced a trading zone characterized by the high and low of 1.14606 and 1.14087, with a minute positive percentage rate of 0.15 as of the time of writing.
GBP/USD Market
Key Levels:
Resistance levels: 1.1650, 1.1750, 1.1850
Support levels: 1.1300, 1.1200, 1.1100
GBP/USD – Daily Chart
The daily chart reveals the GBP/USD market price trades in a bearish cycle, using the trend line of the smaller SMA as a yardstick to decide when a decent downward move will take its course at a high-trading zone afterward. The 14-day SMA indicator is at 1.16504, underneath the 1.20870 line of the 50-day SMA indicator. The Stochastic Oscillators have slantingly swerved southbound from the 80 range to reach 49.20 and 47.49 range values. A bullish candlestick is in the making to show that the market can rally back to a high resistance point for testing purposes. What may have to be traders’ approach by now as the GBP/USD price seems to rally to a high point?
Traders’ approach in the GBP/USD market operations, for now, has to be that they need to wait for what will be the price reaction around the trend line of the 14-day SMA as the currency pair price trades in a bearish cycle. Therefore, buyers have the chance to ride along an upward swing back to resistance around the trend line of the smaller SMA.
On the downside of the technical analytics, the GBP/USD market sellers are to be patient to have other rounds of convergence around the trend line of the smaller SMA. Short-position placers can place a sell limit order around the value line of the 14-day SMA, adhering to the principles of stop loss order also.
In summary, the GBP/USD market’s trading trend yet portends selling force will prevail if bulls lack the energy to push up sustainably past the SMA indicators in the medium or long-term runs afterward. GBP/USD 4-hour Chart
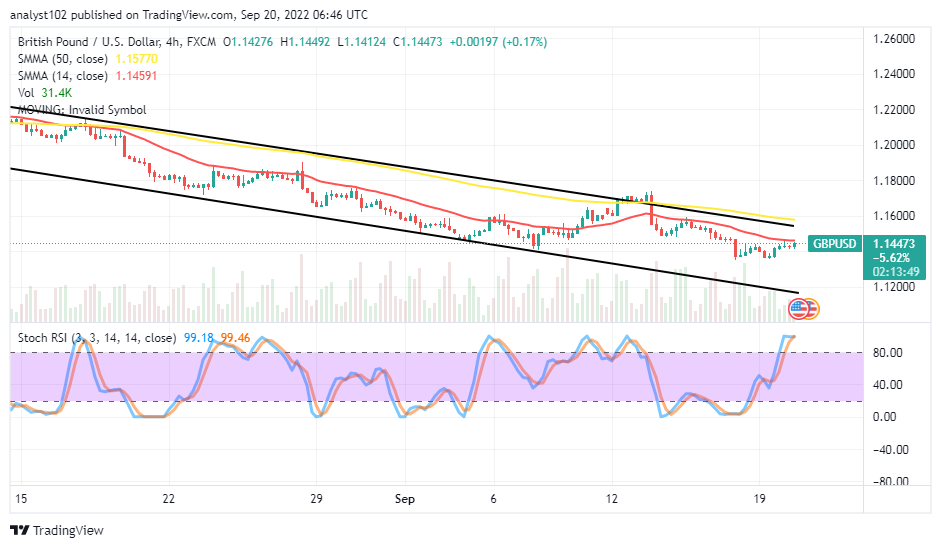
The GBP/USD medium-term chart showcases the currency pair price trades in a bearish cycle. The 50-day SMA indicator positions at the 1.15770 resistance value line over the 1.14591 value point of the 14-day SMA indicator. The Stochastic Oscillators are in the overbought region after reaching 99.18 and 99.46 range values. That signifies the gravitational pressures to back some of the subsequent uprisings at the current trading capacity may be less active. And the prolongation of such presumption can abysmally result in a declination movement afterward.
Note: Forexschoolonline.com is not a financial advisor. Do your research before investing your funds in any financial asset or presented product or event. We are not responsible for your investing results.
Learn to Trade Forex Online
GBP/USD Price Trades in a Bearish Cycle
Footer

ForexSchoolOnline.com helps individual traders learn how to trade the Forex market
WARNING: The content on this site should not be considered investment advice and we are not authorised to provide investment advice. Nothing on this website is an endorsement or recommendation of a particular trading strategy or investment decision. The information on this website is general in nature so you must consider the information in light of your objectives, financial situation and needs.
Investing is speculative. When investing your capital is at risk. This site is not intended for use in jurisdictions in which the trading or investments described are prohibited and should only be used by such persons and in such ways as are legally permitted. Your investment may not qualify for investor protection in your country or state of residence, so please conduct your own due diligence or obtain advice where necessary. This website is free for you to use but we may receive a commission from the companies we feature on this site.
We Introduce people to the world of currency trading. and provide educational content to help them learn how to become profitable traders. we're also a community of traders that support each other on our daily trading journey
Forexschoolonline.com is not a financial advisor. Do your research before investing your funds in any financial asset or presented product or event. We are not responsible for your investing results.

Leave a Reply