British Pound Price Prediction – November 23
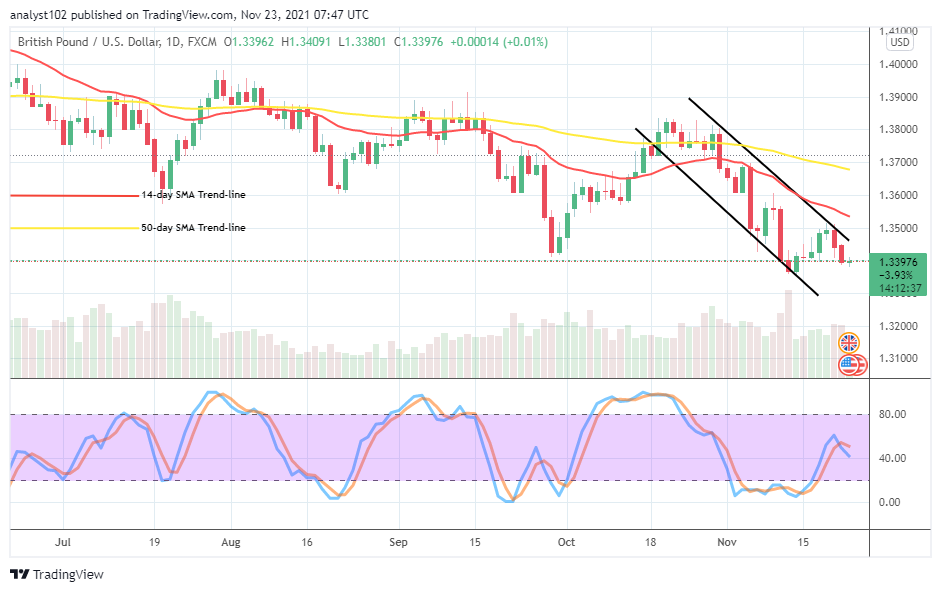
The recent downing motion has led the GBP/USD price trades at 1,3400 lower level than it had once experienced over a week and some days back. Presently, the currency pair market values around 1.3397 at a minute positive percentage rate of about 0.01. That means there has been no cogent-recovery attempt in the market trading activities presently.
GBP/USD Market
Key Levels:
Resistance levels: 1.3500, 1.3600, 1.3700
Support levels: 1.3300, 1.3200, 1.3100
GBP/USD – Daily Chart
The GBP/USD daily chart shows that the currency pair price trades at 1.3400, after hitting resistance around 1.3500 near beneath the trend line of the smaller SMA. That showcases that the market has not been able to swing up out of a depression trading condition as the 50-day SMA indicator is above the 14-day SMA indicator. The bearish channel trend lines are kept intact, slightly extending below the SMAs’ trend lines. The Stochastic Oscillators have initially moved northbound past the range of 40. But, they now try to cross the lines back southbound closely over the range value-line. That probably suggests that the market may be re-settling its stance to gain a definite direction after a while. Are there strong indications that the GBP/USD market will go more under as the currency pair price trades at 1.34000?
There are still indications that the GBP/USD market may go more under as the currency pair trades at 1.3400, most especially while no active re-bounding force re-surfaces at that trading level. In the light of the market seeing more downs from that value line, the currency pair market may head down to re-build a new support baseline around 1.3300 afterward.
On the downside of the GBP/USD market technical analysis, the currency pair short position takers needed to be wary of price actions resulting in to break at 1.3500 as it has shown that a firm resistance trading line has built around it. An aggressive price motion against the value-line will potentially give way to more upswings consequentially.
Summarily, there will still be the need for GBP/USD traders to wait for a while to observe the last reading of the oversold trading condition of the market before considering launching long position orders. The levels between 1.34000 and 1.3300 will play a vital role in the determination of the following directions. GBP/USD 4-hour Chart
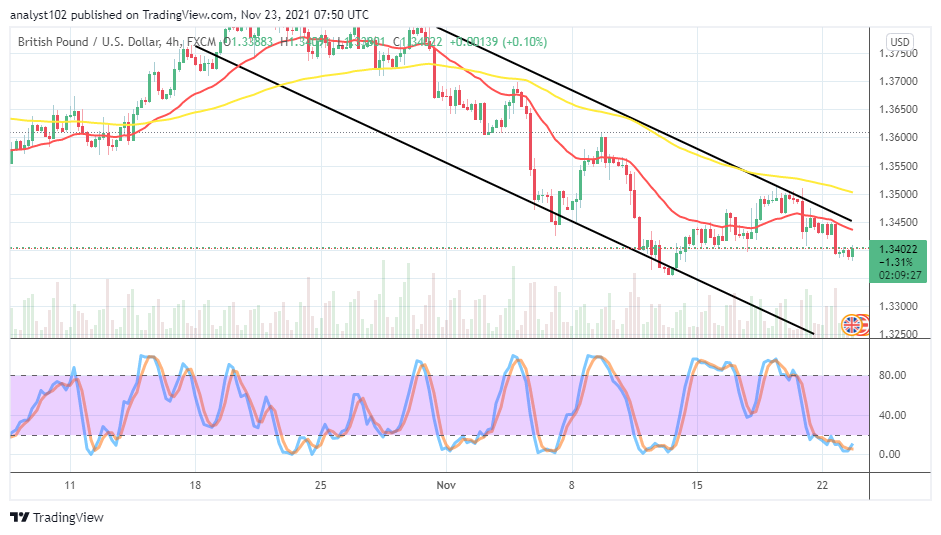
The GBP/USD medium-term chart showcases that the currency pair price trades at 1.34000 after succumbing to a retracement whet it encountered resistance around 1.3500 beneath the bigger SMA trend line. The 14-day SMA indicator is underneath the 50-day SMA indicator. The Stochastic Oscillators are in the oversold region, with the lines conjoined closer to the range of zero. The coin pair trade may soon get support between 1.3400 and 1.3350 levels to resume an upward motion in the subsequent operations.
Note: Forexschoolonline.com is not a financial advisor. Do your research before investing your funds in any financial asset or presented product or event. We are not responsible for your investing results.


Leave a Reply