GBP/USD Price Prediction – June 21
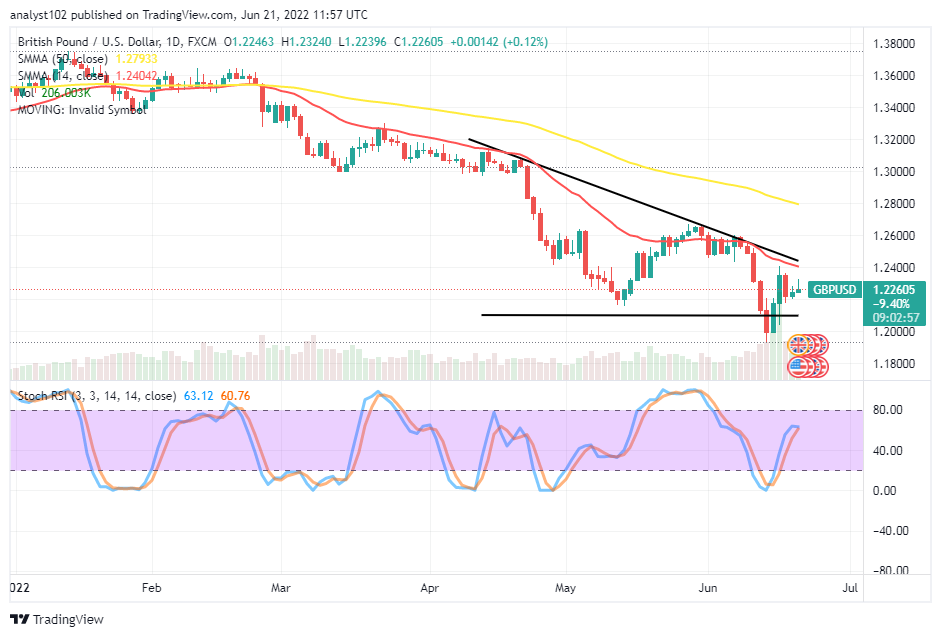
The GBP/USD market price pushes down after hitting resistance around the 1.2400 line a few days back. The currency pair market’s opening balance is at 1.2246 before dropping to 1.2239. Presently, the price is trading at 1.2260 below the higher-trading point of 1.2324 at a minimal positive percentage rate of 0.12.
GBP/USD Market
Key Levels:
Resistance levels: 1.2400, 1.2500, 1.2600
Support levels: 1.2100, 1.2000, 1.1900
GBP/USD – Daily Chart
The GBP/USD daily chart reveals the currency pair price draws down after hitting resistance around the 1.2400 trading level during the 16th day’s session. The bearish trend line has drawn southward to mark the psychological path points to the downward-trending movement that the price maintains around the smaller SMA. The 50-day SMA indicator is above the 14-day SMA trading indicator. The Stochastic Oscillators are attempting to cross the lines around the range of 65 to signify the possibility of the market declining soon. Will the GBP/USD market trade under the 1.2400 resistance level for a long time?
The obtainable trading circumstances in the GBP/USD market operations suggest the currency pair trade will go under the 1.2400 resistance level for a while, possibly back to revisit some of its previous lows around the 1.2000 support level. After then, bulls may strive to make a comeback.
On the downside of the technical analysis, bears may start making comebacks into the market by ensuring they get a powerful downward reversal signal of the price below the 1.24000 resistance level. A rebounding motion against the value line will potentially lead the market to another higher resistant-trading zone.
In summary, the GBP/USD market is experiencing a declination process in its valuation sooner than later, below the 1.2400 resistance level. However, a rebounding motion may occur against the value line and invalidate any selling order around it. GBP/USD 4-hour Chart
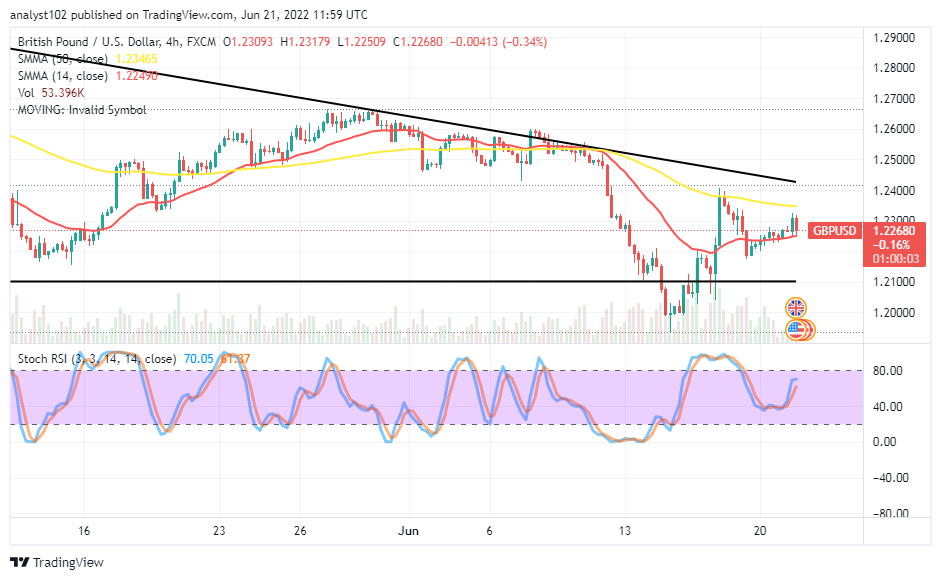
The GBP/USD 4-hour chart reveals the currency pair price draws down after hitting the 1.2400 resistance level around the trend line of the bigger SMA. The 14-day SMA indicator is underneath the 50-day SMA indicator. The bearish trend line draws southward to mark down the 1.2400 as the critical resistant point toward getting smooth upward running. The Stochastic Oscillators are closely beneath the range of 80, making efforts to cross southbound. Today’s selling entry appears to take its course from the point at 1.2300. Therefore, it has to be wary of if the price bounces back against it in no time.
Note: Forexschoolonline.com is not a financial advisor. Do your research before investing your funds in any financial asset or presented product or event. We are not responsible for your investing results.


Leave a Reply