Although GBP/USD price remains in position for more upside move, it appears as if some struggles have started between the bears and bulls in this market. Consequently, this has made the pair to look stranded near the 1.2300 mark.
Important price Levels:
Resistance Levels: 1.2264, 11.2300, 1.2350
Support Levels: 1.2231, 1.2200, 1.2165

GBP/USD Headwind Appears to Be Getting Stronger
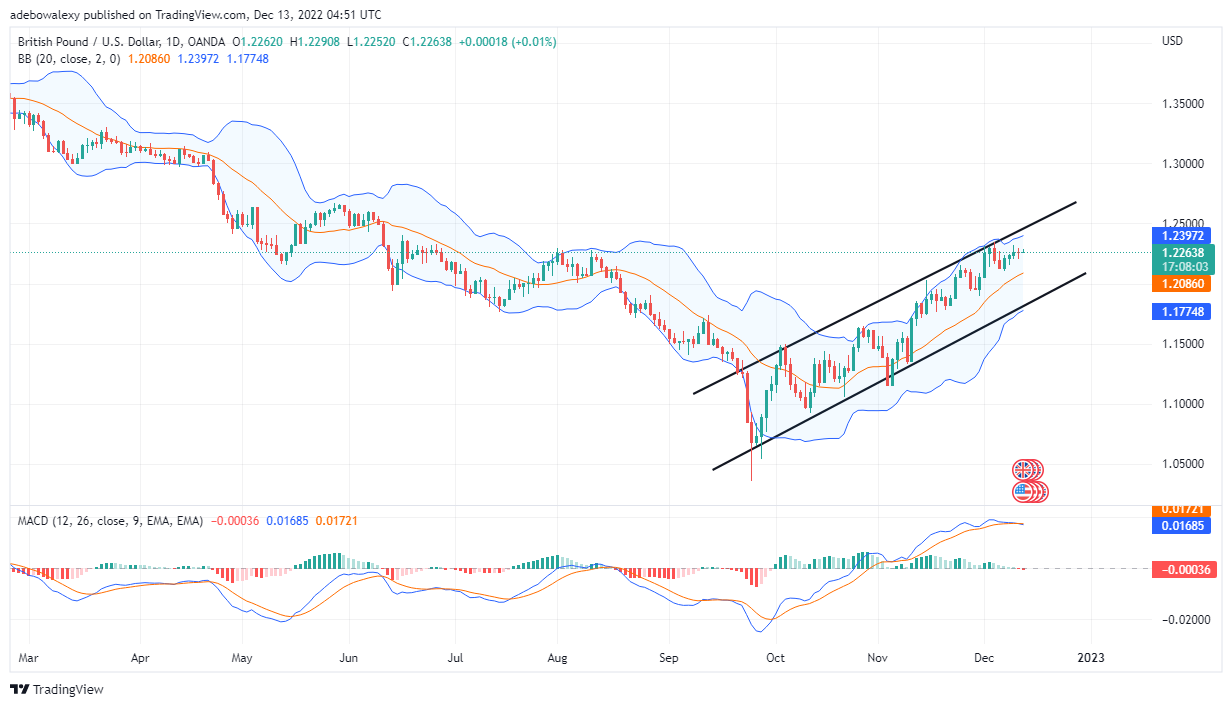
GBP/USD price action on the daily chart portrays a further gradual decrease in price volatility. At this point. The latest price candle, on the daily chart, looks more like a dash candlestick with a wick. Consequently, this reveals the struggle between buyers and sellers, however, going by the color of the candle, buyers have managed to somehow come on top. Furthermore, while price activities remain above the Moving Average line, The Moving Average Convergence Divergence indicator curves could be seen to have merged, and are now journeying sideways. Consequently, this portrays the effect of the noticed struggle on price action. Consequently, if it should grow stronger the current market uptrend may reverse. Nevertheless, since price action is still above the MA line traders can still be hopeful of price increases.

The Nature of GBP/USD Struggle Is Revealed
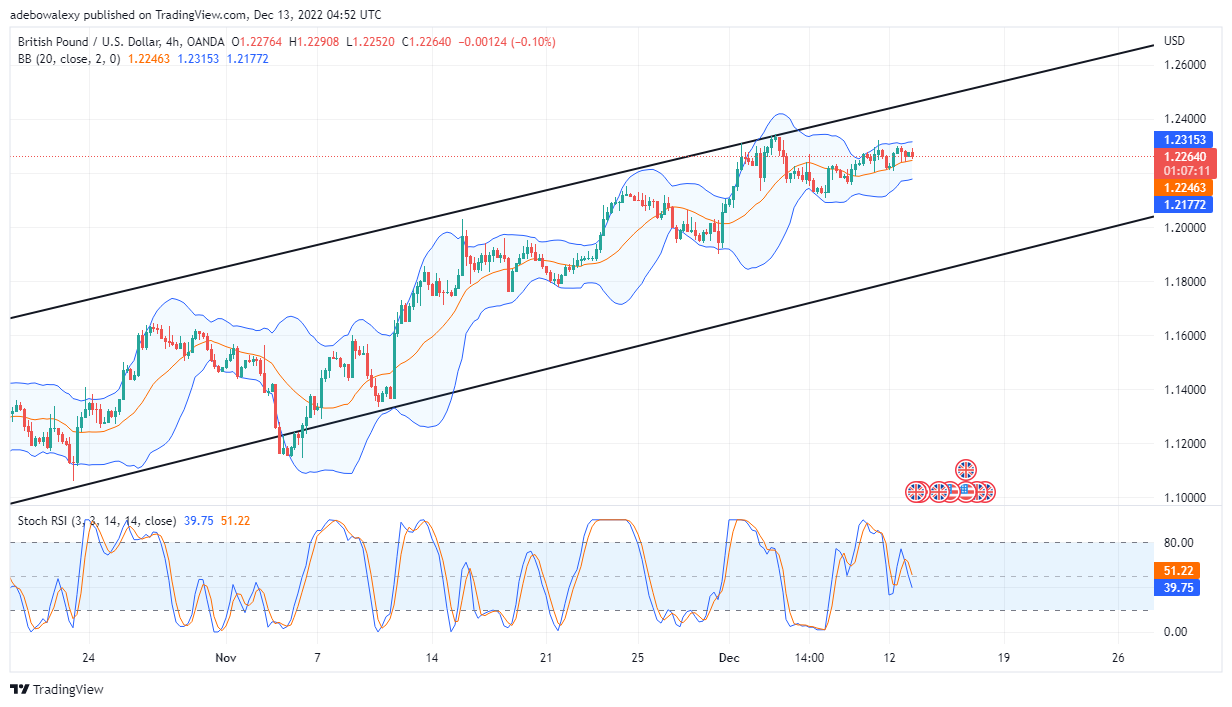
Coming to the four-hour chart, it could be perceived that nearly half of all the gathered profits in the last 24 hours have been lost. The latest price candle that represents the ongoing session portrayed that sellers are dominating. Furthermore, the Stochastic RSI indicator curves are plunging into the oversold area at 51.22 and 39.75 levels. Consequently, this is portraying the activities of sellers in the market. However the overall trading activities are still happening above the Moving Average line, and this seems to maintain price upside hopes. Therefore, longer-term traders can still be hopeful that GBP/USD price may continue to move towards the 1.2500 mark.
Do you want to take your trading to the next level? Join the best platform for that here


Leave a Reply