GBP/USD Price Prediction – October 4
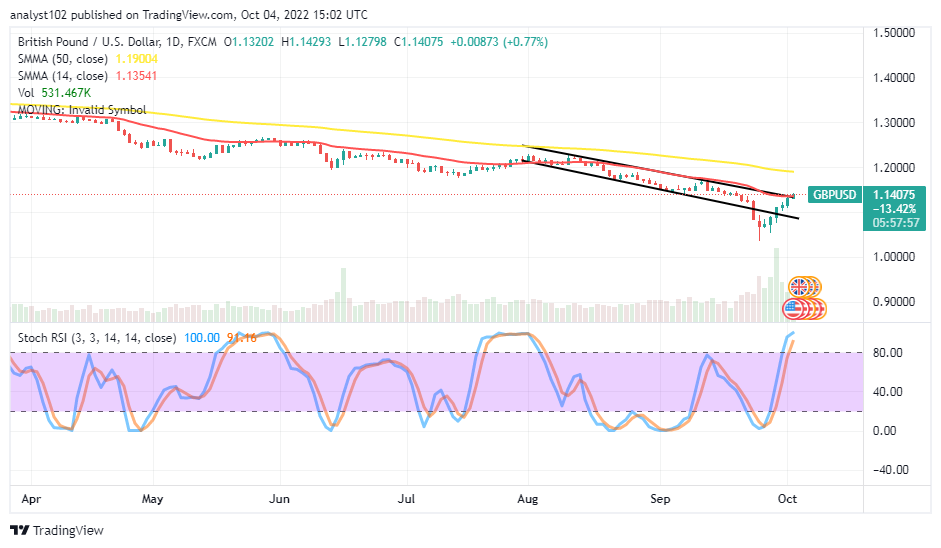
The GBP/USD market price is recovering steadily at a high rate in an extensive-moving mode to a psychological point. As of the time of writing, the currency pair trades around 1.14075 points between the high and low of 1.14293 and 1.12798 value lines, keeping a minute average rate of 0.77% positive.
GBP/USD Market
Key Levels:
Resistance levels: 1.1600, 1.1700, 1.1800
Support levels: 1.1000, 1.0900, 1.0800
GBP/USD – Daily Chart
The daily chart showcases the GBP/USD market is recovering steadily as the price pushes from a lower-trading zone to the trend line of the smaller SMA. The 14-day SMA indicator is at 1.13541, underneath the 1.19004 value point of the 50-day SMA indicator. The bearish channels remain drawn intently as the upper bearish trend line is drawn tightly alongside the smaller SMA. The Stochastic Oscillators have penetrated the overbought region, placing their lines briefly northbound at 91.16 and 100 range values. Will the GBP/USD market survive breaching northwardly at the smaller SMA trend line?
The GBP/USD market price is recovering steadily to reach the trend line of the smaller SMA’s value point. A further northward breaking move may not hold firmly above the smaller SMA. And, even if a spike occurs around the trading indicator in question, it will take a while, during which necessary correction may prevail.
On the downside of the technical analytics, sellers may need to suspend the execution of shorting orders for the time being to allow a formation of signaling variant rejections between the trading spaces of the SMA trend lines before considering a re-launch of selling orders.
In summary, the general trading cycle dominance in the GBP/USD market is on a buying spree, heading toward exhaustion sooner than later below or around the 50-day SMA’s value line. Therefore, long-position placers should be wary of any active reversal motion in no time. GBP/USD 4-hour Chart
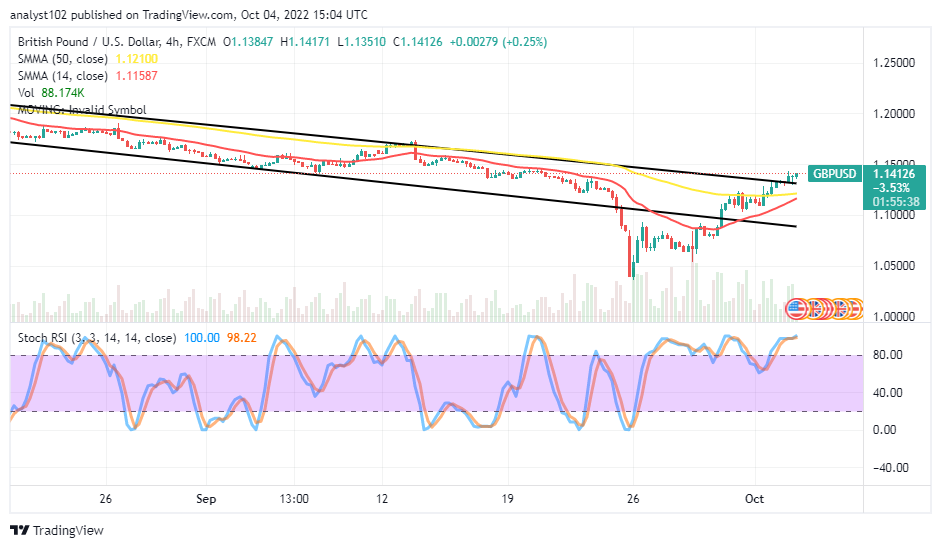
The GBP/USD medium-term chart portrays the pairing fiat coin’s price as recovering steadily, having been able to breach northward past the trend lines of the SMAs to the north side. The 14-day SMA indicator is at 1.11587 points, underneath the 1.12100 value line of the 50-day SMA indicator. A chain of smaller bullish candlesticks has formed above the upper bearish trend line drawn. The Stochastic Oscillators have been in the overbought region, maintaining 98.22 and 100 range values in the upside direction. Buyers may lose momentum.
Note: Forexschoolonline.com is not a financial advisor. Do your research before investing your funds in any financial asset or presented product or event. We are not responsible for your investing results.


Leave a Reply