British Pound Price Prediction – January 4
The present trading condition of the GBP/USD trade operation experiences that its price hits a resistance below 1.3600. The currency pair price opens around 1.3476 to now trade around 1.3473 at a smaller negative percentage rate of 0.02 as of writing.
GBP/USD Market
Key Levels:
Resistance levels: 1.3600, 1.3700, 1.3800
Support levels: 1.3400, 1.3300, 1.3200
GBP/USD – Daily Chart
The GBP/USD daily chart exhibits that the currency pair price hits a resistance below 1.3600. The bullish recovery channels drew across the trend lines of the SMAs. The 50-day SMA trend line is above the 14-day SMA trend line. During yesterday’s session, a bearish candlestick emerged to denote the possibility of the market declining in another way round. The Stochastic Oscillators have crossed the lines southbound near above the range of 80. Will the GBP/USD market resume downing in its valuation soon as the currency pair price hits a resistance below 1.3600?
The GBP/USD market resuming downing in its valuation would now have to be keeping the activities resisted around the trend line of the 50-day SMA as the currency pair price hits a resistance below 1.3600. In a bid to get a smoother northward motion in continuation of the recovery movement, resistance around the bigger SMA has to breach to the upside afterward.
On the contrary to the upside technical analysis, the GBP/USD market short-position takers will have to consolidate their stances beneath the resistance trading level of 1.3600 for the exertion of more depressive motions. An eventual fearful southward breakdown of the 14-day SMA trend line will signify a sound returning of a bearish trading cycle under that capacity.
Summarily, it now appears that the GBP/USD market operation has reached a higher point in its recovery price movement. And as a result, will now have to downsize underneath the resistance level of 1.3600 for another bearish cycle. GBP/USD 4-hour Chart
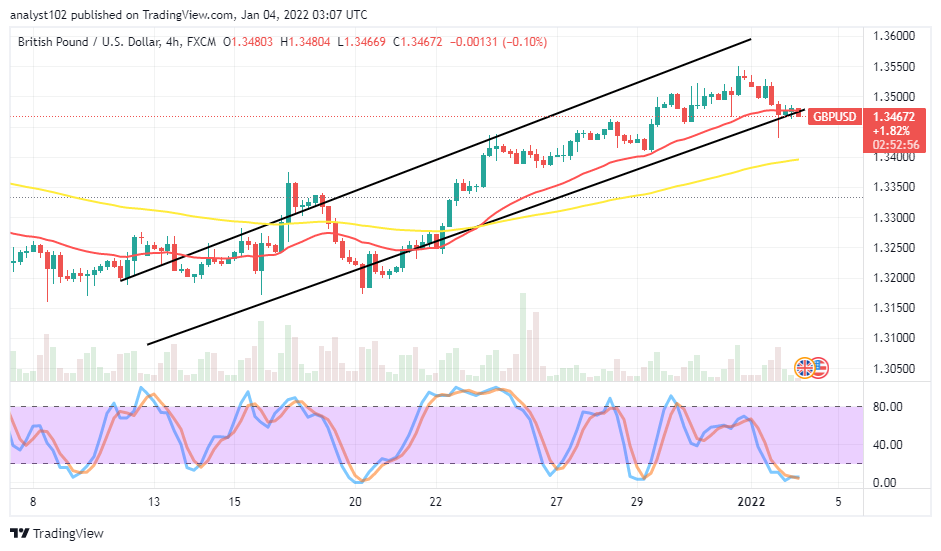
The GBP/USD medium-term chart reveals that the currency pair price hits a resistance below 1.3600 in the bullish recovery channels drawn. Price is now trading around the trend lines of the lower bullish channel and the 14-day SMA. The 50-day SMA trend line is underneath them at around 1.3400 support level. The Stochastic Oscillators are in the oversold region, with the lines clogging together a bit above the range of zero. That could mean the currency pair market may strive to move up for a retest of a higher point before resuming a downward trend in the aftermath of that presumption.
Note: Forexschoolonline.com is not a financial advisor. Do your research before investing your funds in any financial asset or presented product or event. We are not responsible for your investing results.


Leave a Reply