GBP/USD Price Prediction – January 25
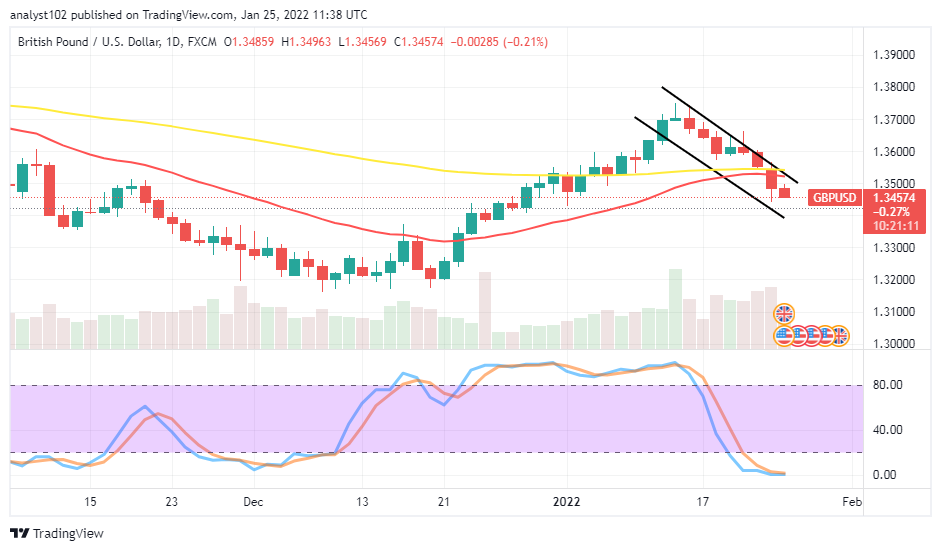
It has occurred that the GBP/USD market witnesses a significant loss when it couldn’t sustain staying afloat over 1.3700 as the currency pair price falls off several pips numbering close to 400 in the last couple of days. The market is trading between 1.3496 and 1.3456 values at a minute relatively negative percentage rate of 0.21.
GBP/USD Market
Key Levels:
Resistance levels: 1.3500, 1.3600, 1.3700
Support levels: 1.3400, 1.3300, 1.3200
GBP/USD – Daily Chart
The GBP/USD daily chart shows the currency pair price falls off several pips since the two candlesticks that emerged between January 13 and 14 ended with top shadow shapes at 1.3700. Variant bearish candlesticks have featured in a correctional-moving style immensely against the trend lines of the SMAs. The 50-day SMA indicator is tightly above the 14-day SMA indicator. The downward correction channel trend lines drew to ascertain the path from price declines to the downside. The Stochastic Oscillators are in the oversold region, placing tightly on the range of zero to denote that the market has reached a lower psychological spot that the present depression tends to get a respite. Will the GBP/USD market decline steadily as the currency pair price falls off several pips?
Currently, it appears the GBP/USD market operations tend to continue declining as the currency pair price falls off several pips. Traders intending to go for a long-positioning order may now have to be patient, waiting for about two bullish candlesticks to signal the possibility of seeing an upward motion returning between 1.3400 and 1.3300 levels.
On the downside of the technical analysis, the GBP/USD market short-position takers will have to consolidate their presences around 1.3500 in the subsequent trading sessions. A pull-up or some up-pulls may occur toward the value line to let bears muster the energy to return into a continuation of the downward motion afterward.
In summary, the GBP/USD market has seemingly embarked on a long-term bearish trading cycle. However, if that assumption is un-contradicted by bulls’ reactions, it would be safer for traders to continue looking for decent selling entries at a higher trading spot after the price might have completed a rallying movement. GBP/USD 4-hour Chart
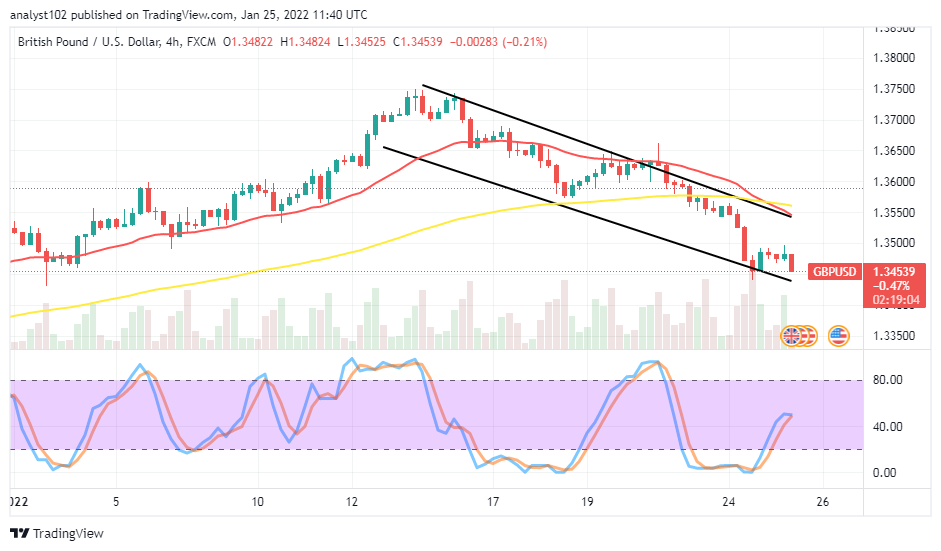
The GBP/USD 4-hour chart shows the currency pair price falls off several pips within the bearish channel trend lines drawn to keep the pace at which the market downsizes. The 14-day SMA indicator has intercepted the 50-day SMA indicator from the top. And they are closely positioned above the upper bearish trend line. The Stochastic Oscillators are attempting to close their lines southbound a bit over the range of 40. Presently, a 4-hour bearish candlestick is in the process of taking a full-fledged form, denoting that a declining force is ongoing.
Note:Forexschoolonline.com is not a financial advisor. Do your research before investing your funds in any financial asset or presented product or event. We are not responsible for your investing results.
Learn to Trade Forex Online
GBP/USD Price Falls off Several Pips
Footer

ForexSchoolOnline.com helps individual traders learn how to trade the Forex market
WARNING: The content on this site should not be considered investment advice and we are not authorised to provide investment advice. Nothing on this website is an endorsement or recommendation of a particular trading strategy or investment decision. The information on this website is general in nature so you must consider the information in light of your objectives, financial situation and needs.
Investing is speculative. When investing your capital is at risk. This site is not intended for use in jurisdictions in which the trading or investments described are prohibited and should only be used by such persons and in such ways as are legally permitted. Your investment may not qualify for investor protection in your country or state of residence, so please conduct your own due diligence or obtain advice where necessary. This website is free for you to use but we may receive a commission from the companies we feature on this site.
We Introduce people to the world of currency trading. and provide educational content to help them learn how to become profitable traders. we're also a community of traders that support each other on our daily trading journey
Forexschoolonline.com is not a financial advisor. Do your research before investing your funds in any financial asset or presented product or event. We are not responsible for your investing results.

Leave a Reply