GBP/USD Price Prediction – April 27
The trade worth of the GBP/USD instrument has continued to feature in small-scaled range-bound trading zones coupled with retracement moving outlook since last time that it made a failed breakout of 1.4000 resistance level on April 19 session.
GBP/USD Market
Key Levels:
Resistance levels: 1.4000, 1.4100, 1.4200
Support levels: 1.3800, 1.3700, 1.3600
GBP/USD – Daily Chart
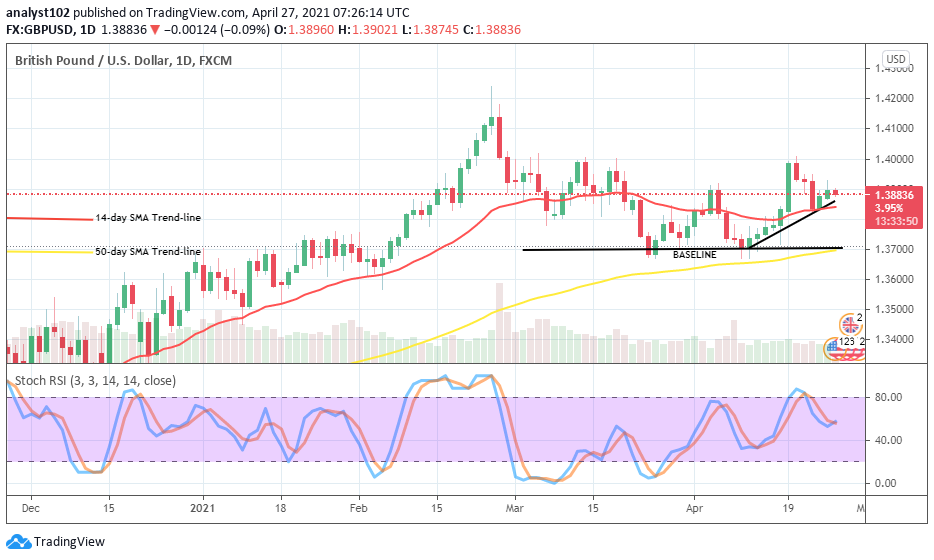
The GBP/USD daily chart shows a relative recovery moving mood of the currency pair as it also features a line of short price reversals. It also depicts the presence of big higher lows and small higher highs below the previous high value of 1.4000 initially achieved in the recent upswing. A small-length bullish trend-line has drawn from the support baseline of 1.3700 to align with the uptrend in the making. As of writing, the 14-day SMA trend-line is above the 50-day SMA indicator below the actual trading point of the currency pair. The Stochastic Oscillators have slantingly bent downward from range 80 to now attempt crossing back towards the north near above range 40. That signifies the possibility that more upsides tend to start occurring soon in the market. Will the GBP/USD market still reverses downward in correction?
The support baseline of 1.3700 as featured on the trading chart will set the market on a journey to the north. But, the degree of price action being put up by bulls in the market isn’t active enough to push northwardly. Therefore, more buying pressures are needed to break through the previous 1.4000 resistance level in the near session.
The GBP/USD bears tend to regain the market strength between the resistance points of 1.4100 and 1.4200. The value of 1.3700 will serve long against the possibility of breaking down further below even if eventually huge decline pressure emerges in the market.
To streamline the whole analysis, the GBP/USD market may keep featuring above the support baseline of 1.3700 as there can as well be a downward correction and, small trading cycle of range-bound formation if the 1.4000 level isn’t breached sustainably to the north. GBP/USD 4-hour Chart
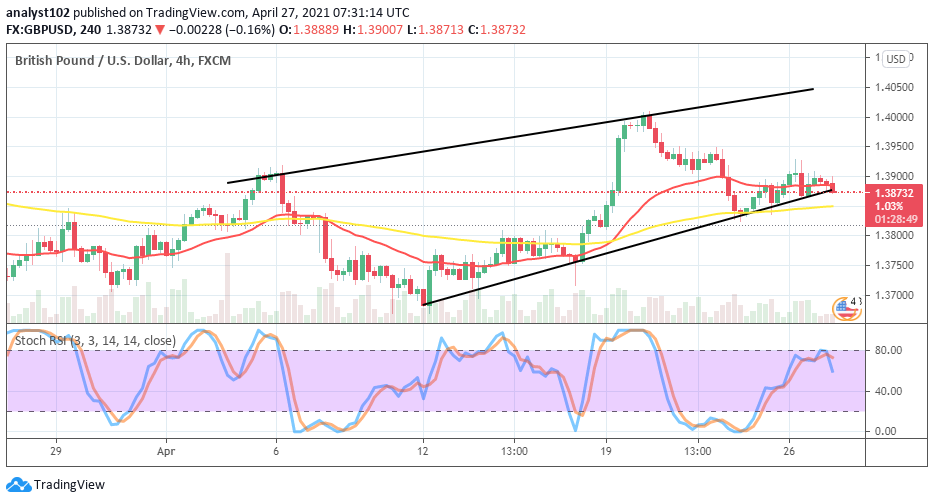
The medium-term chart reveals that the market valuation of GBP/USD is now trading around its lower bullish channel trend-line. Nevertheless, the trend maintains a bullish outlook. The 14-day SMA trend-line is located over the 50-day SMA indicator with a formation of a bearish candlestick in between them. If that candlestick forcefully takes its form, the market value may drop further to find support at 1.3800. The Stochastic Oscillators have slightly crossed to the south to signal a return of downward move.
Note: Forexschoolonline.com is not a financial advisor. Do your research before investing your funds in any financial asset or presented product or event. We are not responsible for your investing results.
Learn to Trade Forex Online
GBP/USD Price Faces a Retracement Move After a Slight Breakout of 1.4000 Level
Footer

ForexSchoolOnline.com helps individual traders learn how to trade the Forex market
WARNING: The content on this site should not be considered investment advice and we are not authorised to provide investment advice. Nothing on this website is an endorsement or recommendation of a particular trading strategy or investment decision. The information on this website is general in nature so you must consider the information in light of your objectives, financial situation and needs.
Investing is speculative. When investing your capital is at risk. This site is not intended for use in jurisdictions in which the trading or investments described are prohibited and should only be used by such persons and in such ways as are legally permitted. Your investment may not qualify for investor protection in your country or state of residence, so please conduct your own due diligence or obtain advice where necessary. This website is free for you to use but we may receive a commission from the companies we feature on this site.
We Introduce people to the world of currency trading. and provide educational content to help them learn how to become profitable traders. we're also a community of traders that support each other on our daily trading journey
Forexschoolonline.com is not a financial advisor. Do your research before investing your funds in any financial asset or presented product or event. We are not responsible for your investing results.

Leave a Reply