British Pound Price Prediction – October 19
The GBP/USD price extends valuation toward the 1.3800 line in a slow and steady-moving manner. The currency pair valuation trades around 1.3779 at a positive percentage rate of about. 0.41.
GBP/USD Market
Key Levels:
Resistance levels: 1.3900, 1.4000, 1.4100
Support levels: 1.3700, 1.3600, 1.3500
GBP/USD – Daily Chart
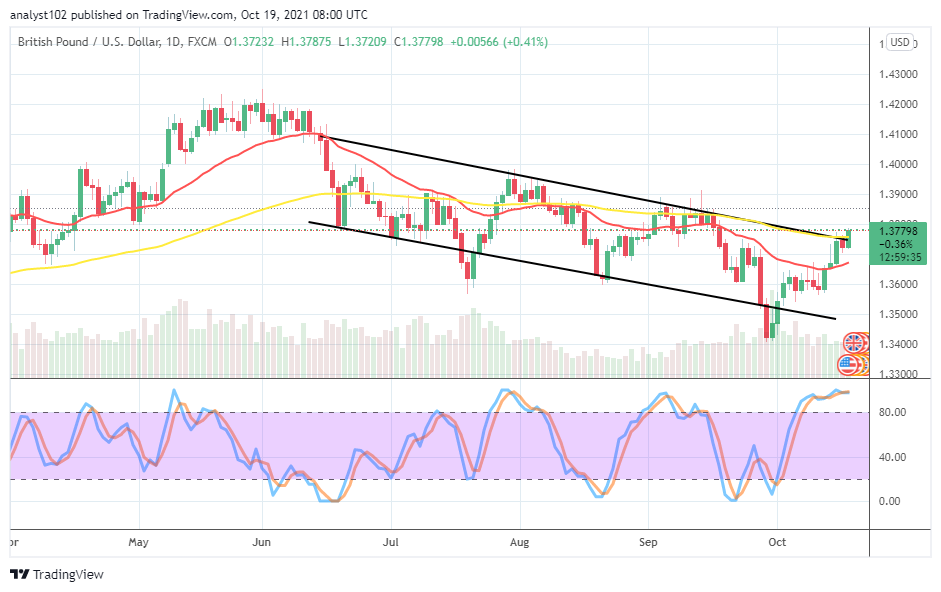
The GBP/USD daily chart showcases that the fiat currency pair price extends valuation toward the 1.3800 trading level. The bearish channel trend lines are intact, depicting that the market is yet to push off away from a bearish trading zone. The upper bearish channel trend line drew along the bigger SMA trend line as a bullish candlestick has emerged against them. The 14-day SMA indicator is underneath the 50-day SMA indicator. The Stochastic Oscillators are in the overbought region with conjoined lines consolidating in it. That means that buying forces are prevailing in the currency pair trading activities. Would the GBP/USD trade upkeep its motions as the currency pair price extends position toward 1.3800 level?
It appears that the GBP/USD trade may get resisted around a higher line as the currency pair price extends position toward 1.38000 level. Joining the current buying motions to the upside may not be that technically ideal as there has been an indication stating that the market now trades in an overbought zone. Long position takers needed to re-strategize their techniques, especially while there are no active price actions.
On the downside, the GBP/USD market bears may re-build their presences around the level of 1.3800 if today’s bullish candlestick finishes with a top shadow sign. Subsequent variant price convergences around the value line could afterward give birth to a downward force return.
In summary, traders are to be cautious of exerting any trading position as of now. Even though price still moves relatively to the up, an indicator has portended that the market is doing so in an overbought trading zone as there can be a reversal in no time. GBP/USD 4-hour Chart
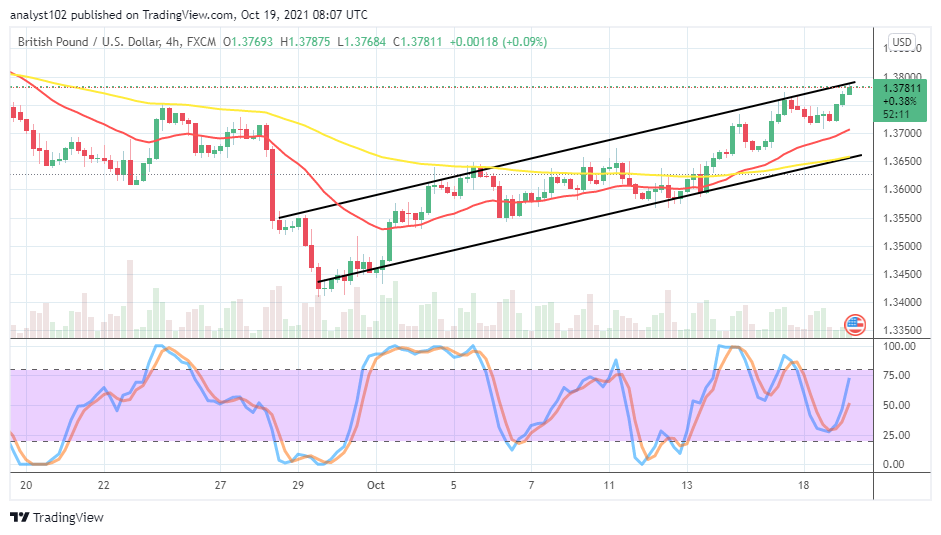
The GBP/USD 4-hour chart also depicts that the currency pair price extends valuation toward 1.3800 resistance level in bullish channel trend lines. The 14-day SMA indicator has intercepted the 50-day SMA indicator to the north side. The Stochastic oscillators have crossed the lines northbound, indicating that some upward forces are ongoing. Presently, the currency pair market faces resistance around the value line mentioned earlier, and in an extension, the higher resistance could be around 1.3850 if breached northward.
Note: Forexschoolonline.com is not a financial advisor. Do your research before investing your funds in any financial asset or presented product or event. We are not responsible for your investing results.
Learn to Trade Forex Online
GBP/USD Price Extends Valuation toward 1.3800
Footer

ForexSchoolOnline.com helps individual traders learn how to trade the Forex market
WARNING: The content on this site should not be considered investment advice and we are not authorised to provide investment advice. Nothing on this website is an endorsement or recommendation of a particular trading strategy or investment decision. The information on this website is general in nature so you must consider the information in light of your objectives, financial situation and needs.
Investing is speculative. When investing your capital is at risk. This site is not intended for use in jurisdictions in which the trading or investments described are prohibited and should only be used by such persons and in such ways as are legally permitted. Your investment may not qualify for investor protection in your country or state of residence, so please conduct your own due diligence or obtain advice where necessary. This website is free for you to use but we may receive a commission from the companies we feature on this site.
We Introduce people to the world of currency trading. and provide educational content to help them learn how to become profitable traders. we're also a community of traders that support each other on our daily trading journey
Forexschoolonline.com is not a financial advisor. Do your research before investing your funds in any financial asset or presented product or event. We are not responsible for your investing results.

Leave a Reply