GBP/USD Price Prediction – August 1
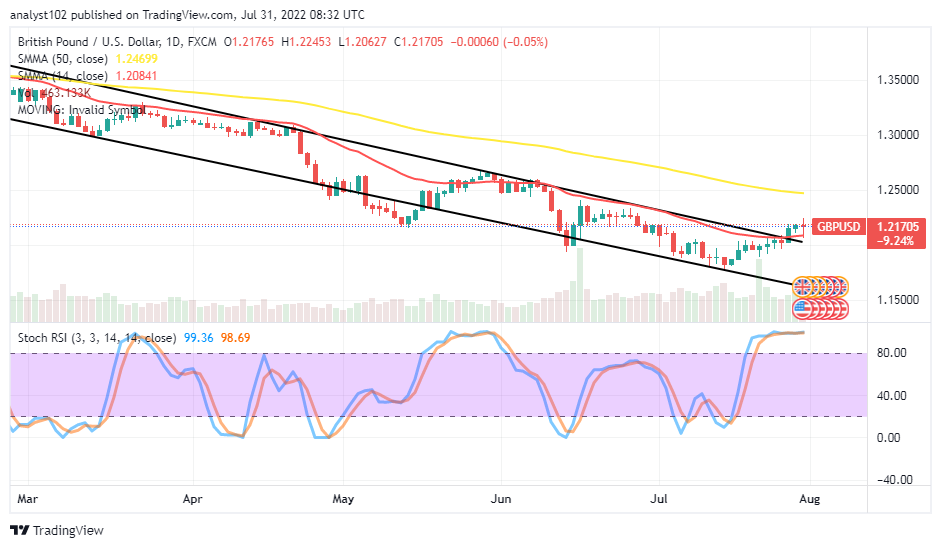
The GBP/USD market trading outlook denotes the currency pair price extends to hit resistance at 1.2200 in what also looks like preparation to let bears regain control. In the latter, the price reached a high of 1.2245 and a low of 1.2062 at a minute percentage of 0.05.
GBP/USD Market
Key Levels:
Resistance levels: 1.2300, 1.2400, 1.2500
Support levels: 1.2100, 1.2000, 1.1900
GBP/USD – Daily Chart
The GBP/USD daily chart reveals the currency pair price extends to hit resistance at 1.2200. The 14-day SMA indicator is underneath the 50-day SMA indicator. The smaller SMA is at the value line of 1.2084 as the bigger SMA is about 385 pips higher above it. The Stochastic Oscillators have penetrated the overbought region, moving in consolidation to signify the force to the upside is not yet giving a damn. Will the GBP market go debasing against the valuation of the USD soon?
The general overriding verdict is that the GBP market operation against the USD price may soon be going down after bulls might have exhausted their forces to the upside. At this point, long-position placers are to suspend further launching of buying orders.
On the downside of the technical, the GBP/USD market bears have the trading space between the trend lines of the SMAs to prepare the stance from where a downward-trending motion can take effect. Usually, a bearish candlestick is required to occur to serve as a confirmation before beginning the launching of sell orders.
In summary, the GBP/USD market is to begin a declining move as it has reached an overbought reading condition worthy of note to signify a resumption of a downward trend is imminent. GBP/USD 4-hour Chart
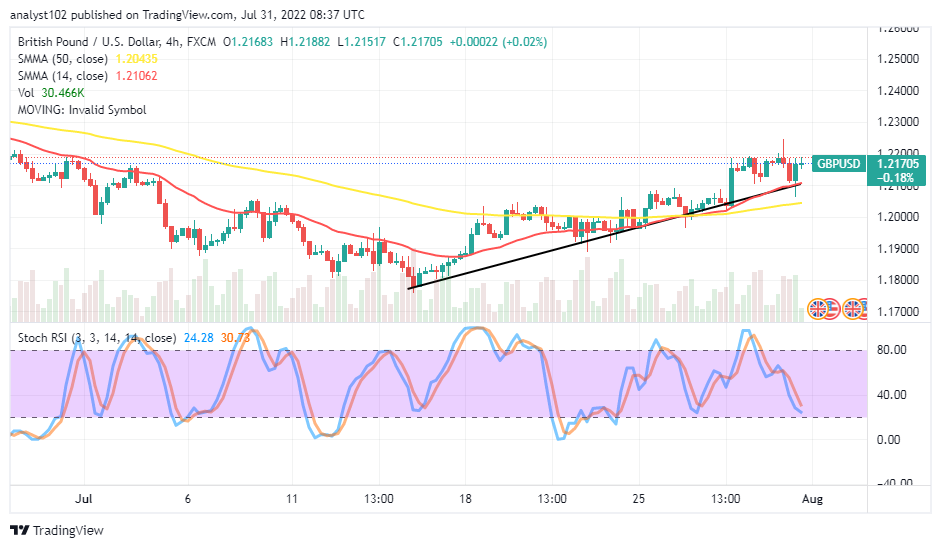
The GBP/USD medium-term chart shows the currency pair market is in a bullish trend as the price extends to hit resistance at 1.2200 above the indicators. The 14-day SMA indicator is over the 50-day SMA indicator. The bullish trend line drew below the bottoms of the candlesticks that majorly form the path to the upside. The Stochastic Oscillators are near above the range of 20, seemingly attempting to close the lines. The situation seems gradually getting exhaustion at higher-trading resistance spots. Therefore, short-position takers may start looking out for false pull-ups to take advantage of afterward.
Note: Forexschoolonline.com is not a financial advisor. Do your research before investing your funds in any financial asset or presented product or event. We are not responsible for your investing results.


Leave a Reply