GBP/USD Price Prediction – November 8
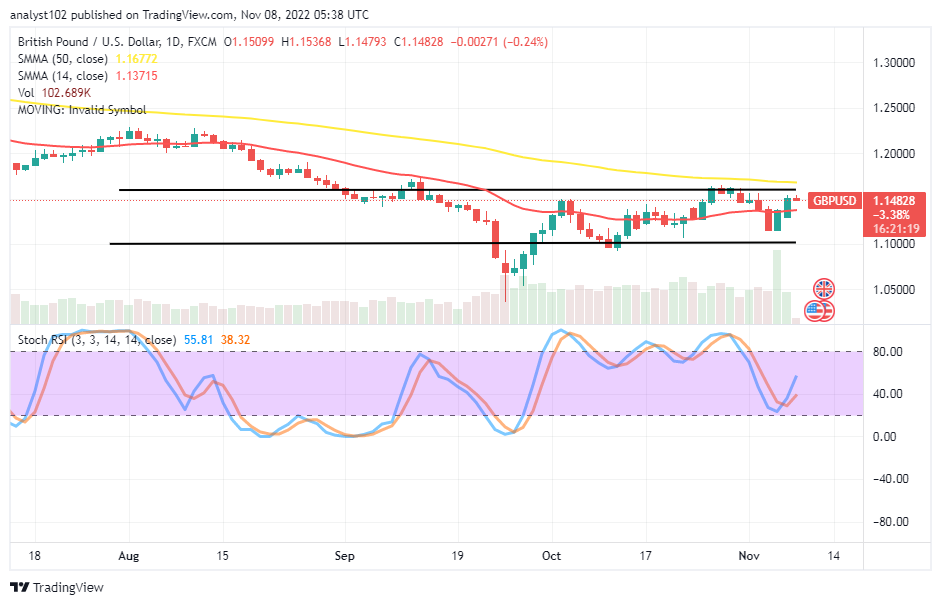
The obtainable trading situation in the GBP/USD market shows the currency pair price efforts move sluggishly below the 1.1600 resistance line. The business is trading at 1.14828 while maintaining a minute minus 0.24%.
GBP/USD Market
Key Levels:
Resistance levels: 1.1650, 1.1750, 1.1850
Support levels: 1.1200, 1.1100, 1.1000
GBP/USD – Daily Chart
The daily chart showcases the GBP/USD market price efforts moves sluggishly below the 1.1600 resistance level. The market’s significant movements are depicted by the horizontal lines drawn within the range-bound zones are within the range-bound zones. The 14-day SMA indicator is at 1.13715, underneath the 1.16772 value line of the 50-day SMA indicator. The Stochastic Oscillators have crossed northbound from a near point over the range 20 to reach 38.32 and 55.81 levels. Should buyers follow the trend if the GBP/USD market breaks the 1.1600 resistance afterward?
Buyers may be trapped if a breakout occurs against the 1.1600 resistance afterward as the currency pair price efforts move sluggishly below the value line. In other words, long-position placers would, at this point, be wary of following moves beyond the trend line of the bigger SMA.
On the downside of the technical analysis, as it has been, the GBP/USD market will soon experience a declining motion. Short-position takers may now begin to execute shorting positions, using the value of the 50-day SMA at 1.16772 as the stop loss order.
In conclusion, the GBP/USD market bears have not yet fully emerged to exploit the scenario as the price moves closer to the 1.1600 resistance trading level. Long-position takers stand a riskier time if they intend to launch fresh longing orders at this point. GBP/USD 4-hour Chart
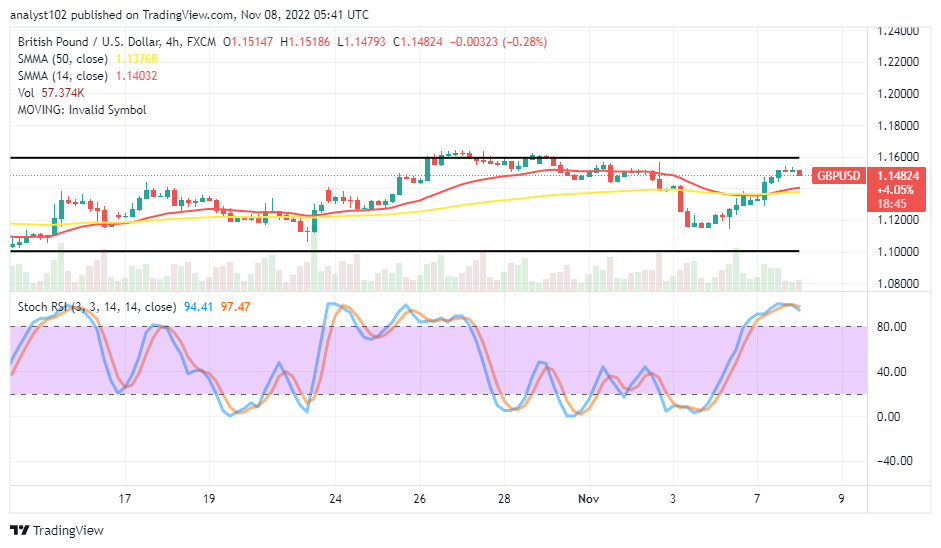
The GBP/USD medium-term chart reveals the currency pair price efforts move sluggishly below the 1.1600 resistance level. There has been a series of smaller-ups across the trend lines of the SMAs. And they are in the range-bound spots, identified around the points of 1.1600 and 1.1000. The 14-day SMA is at 1.14032 above the 1.13768 value line of the 50-day SMA. The Stochastic Oscillators are attempting to cross their lines southbound in the overbought region at 97.47 and 94.41 levels. That shows a falling force is imminent.
Note: Forexschoolonline.com is not a financial advisor. Do your research before investing your funds in any financial asset or presented product or event. We are not responsible for your investing results.


Leave a Reply